How do student achievement trends in your state compare with those in other states? How about with the U.S. as a whole?
The State Academic Performance and Improvement Tool allows you to easily compare your state’s current performance and improvement to that of other states and the national average over time. The tool uses data from the National Assessment of Educational Progress (NAEP), the only assessment with comparable results for all 50 states.
The tool includes state and national NAEP results in fourth-grade and eighth-grade reading and math. You can view results for students overall, as well as for different groups of students: low income and higher income, white, African-American, Latino, Asian/Pacific Islander, and American Indian.
Here are just some of the questions the tool can help you answer:
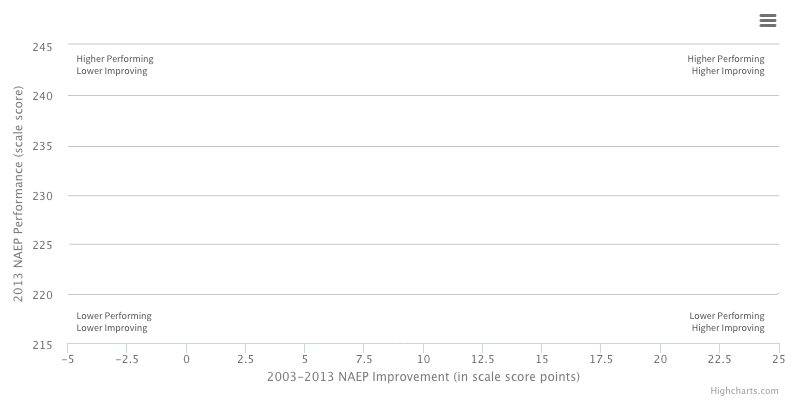
Compared with other states and the nation, how does my state rate on current achievement? How about on improvement over time?
For which groups of students is my state higher achieving and faster improving than other states?
For which student groups is my state lower achieving and lower improving?
Are there states that are doing better or improving faster that hold lessons for my state?
To learn more about NAEP, click here.
State Academic Performance and Improvement Tool
Please select a state from the selection tool, below. This is your focus state. You will be comparing performance and improvement for this focus state with other states you select and with national averages.
Note: You will be able to select additional comparison states below the chart.