ACCESS GRANTED – School Funding Between Schools in Districts
Inequities in school funding between school districts within a state have been well documented, and a few early analyses…
 December 07, 2022 by EdTrust


Inequities in school funding between school districts within a state have been well documented, and a few early analyses…
December 07, 2022 by EdTrust
Inequities in school funding between school districts within a state have been well documented, and a few early analyses have found that there are also inequities in spending between schools within districts. Until recently, that data has been hidden. But thanks to a requirement in the Every Student Succeeds Act (ESSA), most states now include spending data for each school in school report cards. If collected and reported well, this data can provide parents, advocates, and other community members with the information needed to push for fair funding in their local schools. However, we found in a previous analysis that while most states are complying with the ESSA requirement, the vast majority of states don’t go further to report the data in a way that is accessible to advocates and enables equity-focused comparisons. We decided to change that.
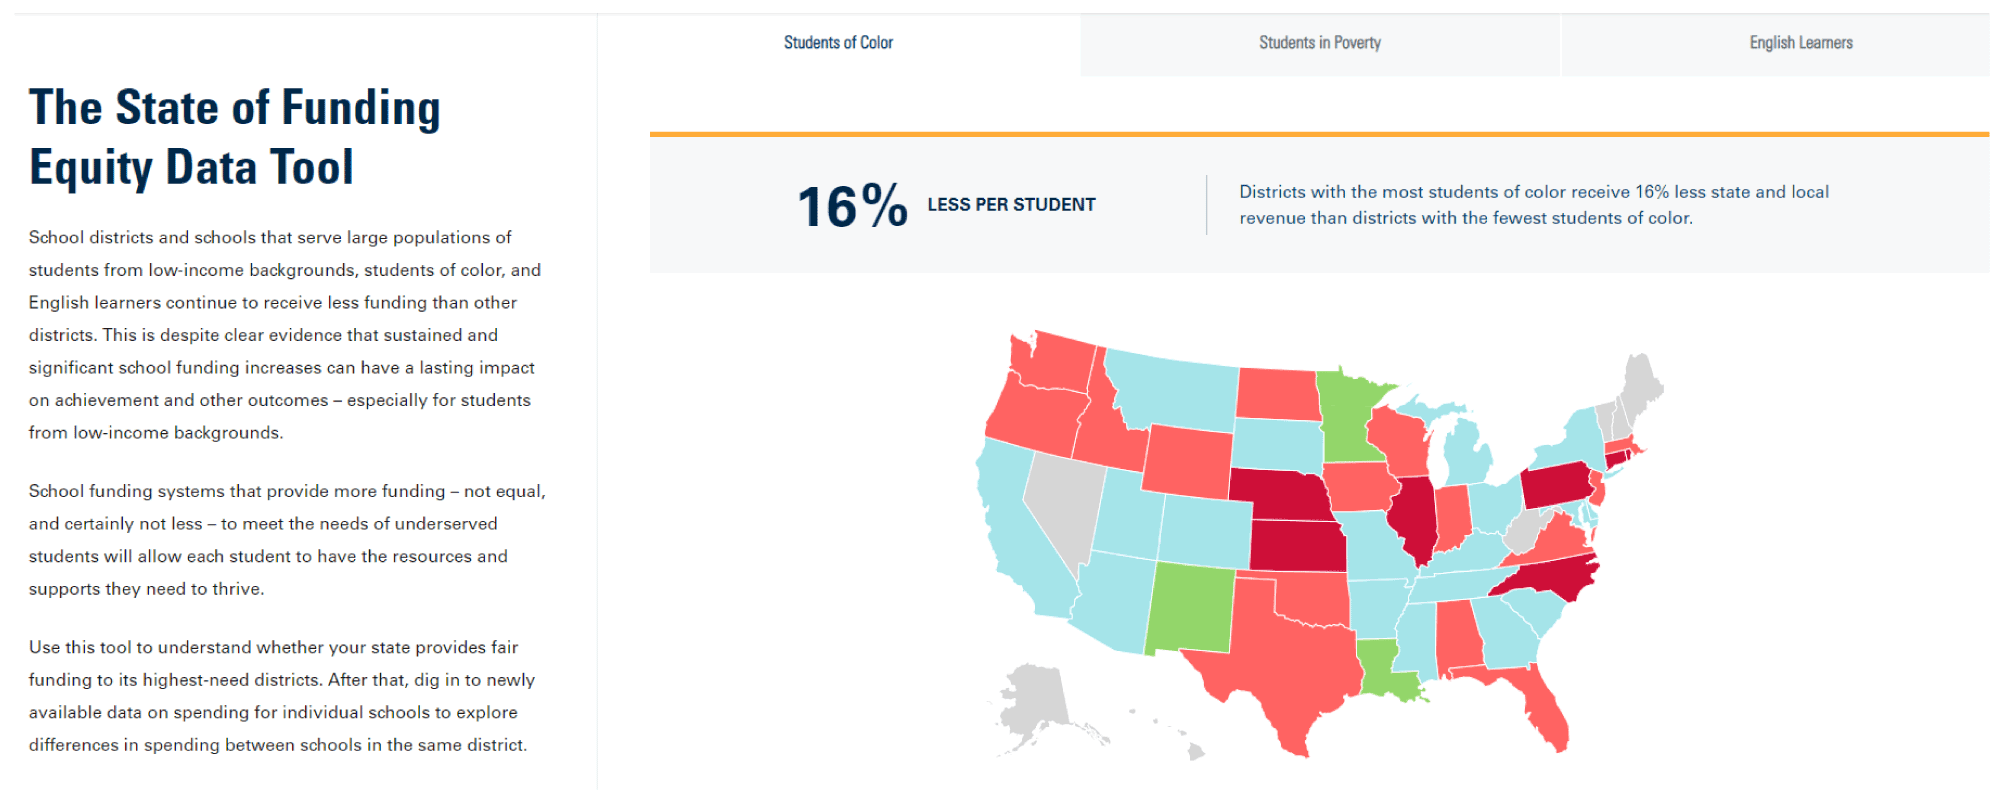
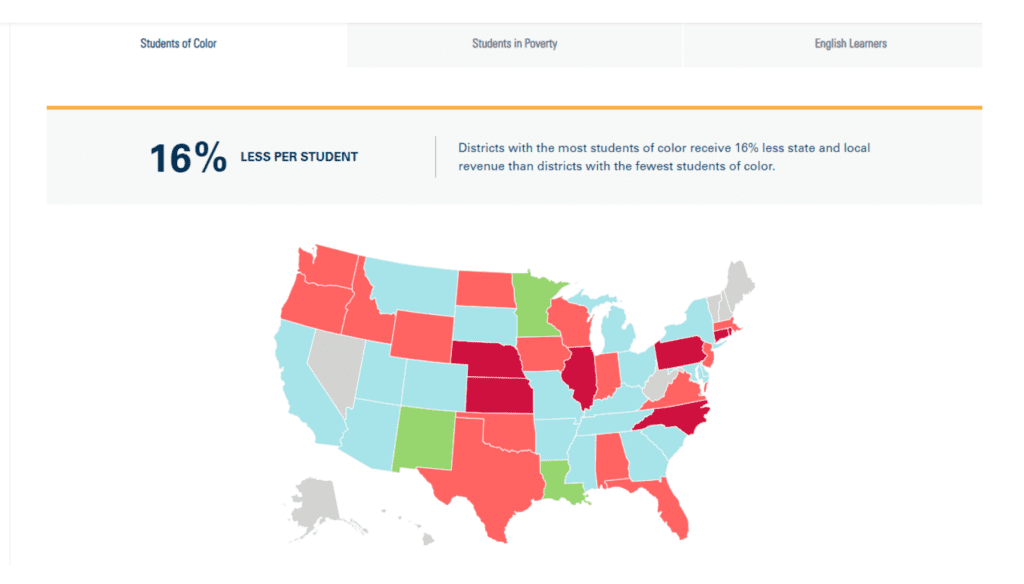
To maximize the impact of this data, we added it to the interactive, advocate-focused data tool, The State of Funding Equity, which includes state-by-state information on school funding inequities between districts based on percentages of students from low-income backgrounds, students of color, and English learners. 1 And for the first time, we included school-by-school spending data, which has the contextual information and across-school comparisons needed to better gauge whether funding is being allocated equitably across schools in a district. The tool also includes a school funding equity rating for districts that answers the question: What are overall patterns of funding equity between schools within districts, for students from low-income backgrounds, Black students, Latino students, Native students, and English learners?
This analysis provides a unique peek into patterns of funding equity (or inequity) that exist within school districts, based on the new school-by-school spending data that are available because of the new federal requirement in ESSA. We found:
For more detailed information, view The State of Funding Equity data tool, which allows users to view individual school data for most schools across the country, districtwide averages for most districts in the country, and district-specific equity ratings for about 3,000 districts in the country, in addition to state-by-state analyses on equity in state and local school funding.
The data and analyses presented in The State of Funding Equity data tool can help advocates and other community members push for changes that are specific to the unique challenges in their school district, based on the assessment of school funding equity. Given the long-standing inequities in school funding and other educational resources , particularly for students in communities of color or low-income communities, there is always room for improvement.
If funding in your school district looks progressive, make sure that it really is. Funding that schools receive from federal, state, and local sources is supplemented by private contributions from sources such as parent organizations and private philanthropy. These supplemental contributions can contribute to inequities in schools’ available resources and are not necessarily captured in the school spending data that ESSA required. So, if funding in the school district seems progressive, make sure that the data is complete and includes all resources available for a school leader to spend.
If funding is regressive, determine the potential root causes by asking the following questions about district resource allocation policies and practices, and explore the potential actions noted in the Resource Equity Guidebook on school funding from the Alliance for Resource Equity (ARE), a partnership between Ed Trust and Education Resource Strategies.
To help paint a clearer picture of patterns in spending between schools, we created equity ratings for school districts by first calculating the average spending in each district, overall, for five groups of students 5 : Students from low-income backgrounds; English learners; and Black, Latino, and Native students, and for three comparison groups of students: Students who are not from low-income backgrounds; students who are not English learners; and students who are not Black, Latino or Native. These average spending numbers are calculated separately by source of funding (federal, state and local, or total) and by school grade span (elementary, middle, high). Next, we compared average spending for each student group to its comparison group, by source of funds and grade span.
Districts with equitable school funding have spending for the group of interest that is at least 40% more than the reference group; progressive spending means spending for the group of interest is between 10% and 40% more than the reference group; regressive funding means spending for the group of interest is 10% less than spending for the reference group. Spending for the group of interest that is equal or up to 10% higher than the reference group is “flat.”
This analysis is based on data that many states have not reported before, and as such, subject to some limitations. Some larger districts do not have enough variation in student demographics to calculate ratings. For example, Philadelphia reports that almost 100% of students are students from low-income backgrounds, so there are not enough students in the comparison group of students who are not from low-income backgrounds to calculate an equity rating.
There are about 3,000 districts that are large enough to conduct the equity analysis. While these districts represent 22% of all districts in the country, they serve about two-thirds of all students. Compared to the country as a whole, these districts have similar percentages of Black, Latino, Native, and English learner students; however, these districts have smaller shares of students from low-income backgrounds (42% in the analysis vs. 51% overall).
The State of Funding Equity data tool presents a comprehensive look at school funding equity between districts in states, and between schools in districts. Specifically, the tool:
The State of Funding Equity data tool does not facilitate comparisons of the ESSA school-by-school spending across districts in a state or across states, because ESSA did not require it. 6 However, the analysis of school funding equity within districts is helpful to summarize the patterns that exist across the country.