Reassessing ESSA Implementation: An Equity Analysis of School Accountability Systems
School accountability systems should ensure all students have necessary resources. EdTrust finds many states’ reporting isn’t equitable.


School accountability systems should ensure all students have necessary resources. EdTrust finds many states’ reporting isn’t equitable.

EdTrust believes that states’ school accountability systems should be designed and implemented to ensure all students have access to high-quality learning experiences by identifying schools producing the lowest outcomes for students and providing these schools with the additional resources and supports they need to improve, while providing all schools with data that can inform resource allocation and continuous improvement efforts. However, our recent review of publicly available information on state accountability systems reveals that states have a long way to go in realizing the promise of leveraging these systems to support school improvement and, ultimately, better opportunities for all students.
First, we find that states have a mixed record on centering equity in how they rate schools and identify them for improvement. We see a similar trend in state reporting systems with the most room for improvement needed in framing accountability data with asset-based language and making it easier for users to compare data across schools and districts. Most concerningly, though, we find that states are largely failing to connect their school identification process to robust systems of support to improve outcomes for students — with little evidence that states are effectively implementing key federal provisions designed to support school improvement. Despite these worrying trends, we’ve identified some promising practices in various states and made recommendations about how these practices can be scaled or affirmed through changes to federal policy.
This interactive, digital report outlines the principles we believe states should be using to uphold federal requirements and deliver on their promise to support and strengthen schools, close opportunity gaps, and improve outcomes for all students. Our analysis 1) identifies trends in state systems connected to these principles; 2) highlights promising practices in states that we believe other states should emulate; and 3) provides federal recommendations based on our analysis of states’ current systems.
 With its passage in 2015, the Every Students Succeed Act (ESSA) gave states substantial flexibility in designing their school accountability systems. The previous version of the Elementary and Secondary Education Act (ESEA), No Child Left Behind (NCLB), set an ambitious goal of having every student in the country achieving on grade level by 2014, but left many state leaders and school educators feeling unsupported and unfairly punished for not reaching the federal government’s inflexible, unattainable, and one-size-fits-all goal.1
Additionally, the law’s singular focus on grade-level proficiency failed to account for the dramatically varied needs of different schools’ student populations and the attributes that make a high-quality school.2
Despite its flaws, NCLB forced states, districts, and schools to focus — for the first time — on the performance of all students by requiring states to identify schools for improvement, not simply based on averages, but on the performance of each student group. This was an incredible victory for equity, and ESSA kept key aspects of NCLB that centered student equity, including the requirement that states continue to assess all students’ performance against challenging academic standards every year.
The hope for ESSA was that this important focus on student groups — especially students of color, students from low-income backgrounds, student with disabilities, and multilingual learners3 — would be maintained, while allowing states to expand the definition of school quality by considering academic growth, rather than just achievement, and giving schools credit for the other ways they help set students up for success.
In 2017, following the US Department of Education’s approval of state plans for implementation, an EdTrust review of state plans revealed that, disappointingly, many states were redesigning their accountability systems in ways that still obscured how schools are serving individual groups of students — for example, many states were assigning ratings to schools based predominantly on schoolwide averages and/or setting a very low bar for identification of schools in need of supports for improvement.4
As we approach the 10-year anniversary of the law’s passage, EdTrust has undertaken a new review of states’ approaches to federal school accountability, many of which are shifting in response to the school closures and unfinished learning from the COVID-19 pandemic and ongoing engagement with communities. This analysis of state ESSA plans looks at the federal government’s important role in school accountability and reexamines states’ plans against the equity principles that grounded our original analysis, in the context of recent research on implementation, and with an eye toward how states are implementing school improvement provisions in the law and publicly reporting data on school performance. 5
The results of our analysis weren’t reassuring. While state leaders look beyond test scores to evaluate schools and have incorporated student growth indicators into their accountability systems, our findings show they still aren’t doing enough to center the performance of underserved student groups and move all students forward:
States have a mixed record of centering equity in school ratings and identification. Most states measure growth in ways that don’t focus on moving students toward meeting grade level standards. Additionally, states haven’t used federal flexibility to include the performance of student groups in school ratings. Although most states are adequately considering student group performance when identifying schools for improvement, only about half are leveraging the school identification process to ensure that schools with disparities in student outcomes have access to needed state and federal supports.
States have a lot of room for improvement in building accessible and actionable reporting systems. About half provide stakeholders with summative ratings — which can send clear signals about school quality — and a similar share lets users compare schools on their state school report card websites. Few states, however, enable comparisons among similar schools and by student demographics, which would go a long way toward helping stakeholders understand how to improve schools, and only a handful of states frame the data in a way that highlights schools’ strengths and underscores that it’s the school system’s responsibility to meet the needs of all
States have largely failed to leverage school improvement provisions in federal law. No state has set exit criteria for identified schools that ensure that schools are effectively making meaningful and sustainable progress toward improved student outcomes. And most states have also failed to clearly outline how they will support and intervene when schools don’t meet exit criteria. Additionally, while ESSA contains provisions that give states flexibility in supporting districts to identify and understand resource inequities — which are key for driving school improvement — most states have used it to abdicate responsibility. Finally, while most states publish information about how they are using federal school improvement funds, more research is needed to understand the extent to which these funds are supporting schools’ efforts to address student needs. Each of these provisions are crucial to ensuring the data from accountability systems leads to real changes in resources, policy, and practice. If states, districts, and schools are not using data to identify and address inequities, these systems are not fulfilling their main purpose: to improve meeting the needs of all students.
Fortunately, there are actions federal and state policymakers can take to strengthen schools, close opportunity gaps, and improve student outcomes. This report highlights the need for school accountability and better data; the role of government at the federal, state, and local levels in setting expectations, supporting schools, and holding schools accountable, and improving student outcomes; and outlines EdTrust’s vision for school accountability systems. It also provides a framework that states can use to advance equity in their accountability systems.
 The purpose of public education is to provide students with the knowledge and skills they will need to succeed after high school; the ability to access and complete a postsecondary education, pursue a fulfilling career that earns a living wage, and meaningfully participate in our democracy. All students can succeed when provided with the resources and supports to achieve. Yet, generations of students — particularly students of color, students from low-income backgrounds, students with disabilities, and multilingual learners — have been systematically denied equitable access to these educational opportunities — inequities illuminated and exacerbated by the pandemic. Federal accountability requirements are designed to ensure parents, communities, system leaders, and policymakers can better understand which schools and districts are struggling to meet students’ needs and have student group disparities, and — most importantly — use this information to target additional resources and supports to address these needs.
How School Accountability Systems Work
The goals of accountability systems are to:
Accountability systems are designed to improve student outcomes by:
Government Roles & Responsibilities Under ESSA
Each level of government has key roles and responsibilities to ensure that accountability systems are designed and implemented in ways that promote equity and school improvement. State education agencies and state boards of education play the most substantial role under ESSA, but the federal government plays a small but essential role in enforcing, overseeing, and promoting civil rights and equity in education and incentivizing states and school districts to improve schools and student outcomes. Yet recent evidence suggests that both federal and state systems are failing to fulfill their responsibilities, limiting ESSA’s ability to facilitate school improvement.6 7
Federal Roles & Responsibilities
State Roles & Responsibilities
District Roles & Responsibilities
School Roles & Responsibilities
To understand whether ESSA is being implemented in ways that center equity, we looked at states’ most recent ESSA plans, as well as their SEA and school report card websites. While states may be doing more than what’s outlined in these public sources — particularly around supporting school improvement — they provide a window into how states are structuring their accountability systems.
In alignment with EdTrust’s equity principles for accountability, school improvement, and reporting, published in 2019, 9 we believe states can center equity in their school accountability systems by:
Principle #1: Design and use indicators in state accountability systems that keep student learning front and center
Principle #2: Develop school ratings that reflect how schools are serving all groups of students
Principle #3: Establish criteria that honestly identify which schools need to take steps to improve overall or for one or more student groups
Principle #4: Report disaggregated accountability information in a way that is understandable, easily accessible, and widely available
Principle #5: Provide meaningful support to schools that need to improve
 In this report, EdTrust lays out considerations and recommendations for strong, equitable accountability systems that we believe states should be striving toward under the current federal framework. As we move closer to federal reauthorization of ESSA, Congress should also consider changing federal law and accompanying supports to require and incentivize states to more clearly center student equity and continuous improvement in their accountability systems. Additionally, the findings from our analysis of state plans, taken holistically, can inform potential changes to federal policy that may require or incentivize states to develop accountability systems that align with our recommendations for states. Based on our findings, EdTrust believes that the federal government, either through an eventual reauthorization of ESSA or via administrative action, should take the following five actions:
Set minimum n-size requirements. Many states have minimum n-size (i.e., student sample size) requirements that are higher than necessary and, as a result, exclude students from certain subgroups from consideration in school ratings and identification. Setting a federal required minimum of 10 would allow more students to be “seen” by accountability systems and yield better data about student subgroup performance. Similarly, the Department of Education should consider issuing guidance that highlights ways in which states could produce more accurate information about student group performance in school ratings, such as the best practices highlighted in this report.
Provide clear, specific requirements for school identification based on student group performance — potentially removing an identification category. Our findings clearly indicate that many states are not leveraging the flexibility of current school identification processes to create an effective early warning system based on school group performance, and most states are not evaluating student group performance in ways that set high expectations for all students. Setting clear requirements for states during reauthorization would create consistency across states and ensure that underserved students are getting access to the supports they need. Consolidating TSI and ATSI into a single identification category based on student group performance, in conjunction with clearer requirements, could refocus states on more clearly identifying and supporting this group of schools, while also eliminate confusion among stakeholders.
Set specific, rigorous expectations for exit criteria for identified schools and next steps for schools that fail to meaningfully improve. Most states set low performance bars for exiting school identification status and don’t require schools to raise the performance of their lowest performing students and/or fail to ensure schools make sustainable changes to school policies and practices that can be sustained over time. Moreover, many states fail to clearly outline how they will address perpetual low performance. Reauthorization should provide clear, consistent requirements for states on defining exit requirements and next steps for schools that don’t exit, and incentivize states to make long-term, sustainable changes to school practices that can lead to meaningful improvements in student performance. Additionally,, the Department of Education should take steps now to require states to more clearly enumerate their plans for these provisions.
Increase federal monitoring and require state reporting of ESSA school improvement provisions. While states can use resource allocation reviews and school improvement funds as levers to address the needs of identified schools, the lack of transparency, federal monitoring, and technical assistance limits their utility. Addressing these issues could go a long way toward increasing their effectiveness. Additionally, Congress should substantially increase the amount of funding dedicated to school improvement and strengthen the language around resource allocation reviews to mandate state participation. In February 2024, EdTrust submitted comments to the Department of Education urging it to use the Comprehensive Center network to support states in implementing these provisions and supporting school and district leaders in their improvement efforts
Issue guidance and share best practices in accountability reporting. A recent investigation by Education Reform Now 10 found that many states are slow to update their sites and fail to include disaggregated data, despite a federal requirement that they do so. The Department of Education could support clearer data reporting by sharing best practices from state websites that have better disaggregation (above and beyond federal requirements) and data comparison functionality and enable the types of analyses that are useful for starting conversations about school improvement.
Our examination of each of the key questions below, which are based on the framework outlined above, lays out considerations and recommendations for strong, equitable accountability systems that states should be striving for under the current federal law. Such systems should ensure that all students are fully seen by school rating and identification systems, while leveraging federal provisions to support school improvement and providing clear and transparent information on school performance.
To understand how states are centering student learning, we focused on three main aspects of school ratings: how states are measuring growth on academic assessments, how these growth measures are being weighted in school ratings, and how states are using additional “school quality and student success” (SQSS) indicators to expand the definition of school quality.
Measuring Academic Growth
Most states now include some measure of academic growth when rating schools. Growth is an important aspect of school ratings because it can show whether schools are effectively serving students and helping them develop their knowledge and skills. Growth is also considered a fairer measure of school quality because, unlike academic proficiency, which is strongly correlated with student demographics and family income, growth is less influenced by how much access a student has to opportunities outside of school and more reflective of what a student has actually learned. 11 12 Yet, different ways of measuring growth answer fundamentally different questions about how schools are contributing to student success, despite falling under the same label of “growth.”
Of the measures used by states, a value-table measure best fits these criteria. Value-table systems credit schools for moving students within a performance level and/or from one performance level to the next from year to year. This way of measuring growth incentivizes schools to improve the performance of all students, regardless of their previous performance, focuses on moving students toward meeting grade level standards, and can be scored with a simple calculation. Unfortunately, just 13 states use this measure.
Eight states use value-added growth. While this measure is often viewed as strong because it uses advanced statistical modeling to isolate a school’s unique impact on achievement, the use of this measure is concerning because it often controls for student demographics such as race/ethnicity that can produce different growth targets for different student groups. What’s more, the complex calculations it employs may be difficult to explain to stakeholders and the public, potentially undermining trust in the results.
The widespread use of a measure known as student growth percentile (SGP) — which is used by nearly half of states (24) — is also problematic. SGP assesses the progress students are making in comparison to peers with similar previous scores on state assessments — rather than growth toward academic proficiency. Unfortunately, this measure can give a misleading impression of the progress schools are making with students, particularly now when schools are focused on addressing unfinished learning due to pandemic closures. A school in which students made little or no progress toward grade level proficiency can have a positive SGP score, if other students around the state performed worse. And this relative measure takes focus away from the goal of grade level achievement. Even more worrisome, four more states are using SGP than in 2019.13 When it comes to measuring student growth, states are moving in the wrong direction.
Weighting Academic Growth in Elementary & Middle Schools
Beyond how growth is measured, how much relative weight it has in a school rating system has serious implications for schools. If not appropriately weighted, it can skew overall ratings and undermine political support for accountability systems. Weights matter because they reflect where state leaders believe they should focus their improvement efforts and what is valued in the system.
Favoring growth gives schools more credit for the academic indicator that’s more in their control and, therefore, signals to school leaders and educators that their contributions to student achievement are valued by the state. Yet, in 2023, the Tennessee Department of Education slightly shifted its weighting in favor of achievement. While the impact on school ratings hasn’t been investigated, the change was made despite strong objections from the community and has led advocates and school leaders to view the state’s system as less fair. 14
Encouragingly, a plurality of states (13) has weights for achievement and growth that are within five percentage points of one another, while another eight states weigh growth over achievement by 5 to 10 percentage points. By contrast, just four states weigh achievement by 10 percentage points or more than growth.
Expanding Definitions of School Quality
The goal of including an ESSA provision on school quality and student success measures (SQSS) was to provide states with the flexibility to develop a broader definition of school quality that aligns with community values.
Including a few key SQSS measures helps ensure that schools prioritize specific areas and that changes in performance on these measures are connected to meaningful changes in a school’s rating. Having too many indicators might keep schools from focusing their improvement efforts and limit the potential impact that improvement in any one area can have on a school’s final rating.
Overall, most states have limited the number of SQSS measures in alignment with EdTrust’s recommendation: Just 14 have more than three indicators at any one school level, and only three of these states have more than three indicators across all school levels. In all 14 of these states, these indicators are concentrated at the high school level, which likely reflects states’ emphasis on measuring college and career readiness — a topic we’ll explore in more detail below.
The types of indicators states have chosen fall into three categories: (1) student engagement, (2) college and career readiness, and (3) achievement and access in subjects other than English language arts (ELA) and math.
Measuring student engagement can incentivize schools to focus on building a welcoming, supportive school climate, which research shows is a prerequisite for allowing students to fully engage with classroom content and develop their academic knowledge and skills.15 16 17 18 These measures can also identify students who need intervention, prompting schools to provide targeted supports to reengage those students, particularly if schools also track progress throughout the year. 19
Consistent with our previous analysis of state plans, chronic absenteeism measures are by far the most common: 35 states include them in their accountability systems. Chronic absenteeism is considered a strong proxy for student engagement and school climate, and data on absenteeism is readily available. 20 While most of these states rate schools on the percentage of students who miss less than 10% of school (which is the common threshold for chronic absenteeism21), a handful of states take slightly more innovative approaches. For instance, Montana sets a higher bar of 5% of missed school days. Indiana also sets a higher bar (4% of days missed) and gives schools credit for every student whose attendance rose by 3 percentage points from the previous year. This could incentivize schools to support students with many absences.
A smaller number of states use other measures to try to capture student engagement. For example, eight states use a ninth grade on track indicator to determine whether students are earning enough credits to graduate high school on time and encourage high schools to ensure a smooth transition from middle school, which is a crucial predictor of student engagement and persistence. 22 23 Nevada and Arkansas go a step further by also tracking credit accumulation into 10th and 11th grades, respectively.
Five states use school climate surveys to measure whether schools are creating a supportive, welcoming learning environment for students; and Montana plans to add a similar indicator but has yet to determine how school climate will be measured. Though understanding school climate is important for supporting student needs, incorporating the results of these surveys into school ratings — which four of five states do — could create perverse incentives for schools to influence the results, which would produce inaccurate and unhelpful data. 24 To avoid this, Illinois rates schools on survey participation rather than survey results. This encourages widespread completion of the survey, which school leaders and educators can then use to improve practice.
Gaining an understanding of the extent to which students are prepared for postsecondary opportunities remains a key and important consideration of states’ accountability systems: 38 states have at least one measure of college and career readiness as a part of their accountability system. Given the limited requirements for high school assessment and variations in district graduation requirements, having additional measures of the ways in which high schools are preparing students for success is a welcome outcome of the flexibility provided by SQSS indicators.
Based on our examination of states’ use of college and career readiness (CCR) indicators, EdTrust would urge state leaders to consider using both college indicators (like Advance Placement exams and dual credit courses) and career indicators (like CTE concentrations or industry certifications), as well as indicators that focus on student success rather than access to opportunities.
We found that of the 38 states with CCR indicators, more than half (21) include both college and career indicators, and encouragingly, nearly all focus on success in their chosen indicators. States were most likely to focus on passing scores on AP/IB tests (24), dual enrollment course completion (18), qualifying scores on the SAT/ACT (16), industry certifications (16) and CTE course/concentration completion (10). An additional 12 states also include measures of military readiness, typically success on the Armed Services Vocational Aptitude Battery (ASVAB) assessment.
EdTrust believes that high schools should set students up for success after high school. Therefore, we also looked at the extent to which states included measures of student success beyond high school. Just four states — Connecticut, Georgia, Iowa, and West Virginia — do, and all four use a measure of enrollment in postsecondary education as a part of their college and career indicator. State leaders may be under political pressure from school leaders to omit such measures. And many school leaders report that they do not even have access to data about their students’ postsecondary applications, postsecondary enrollments, or FAFSA completions, and feel that the most significant barriers preventing students from successfully transitioning to postsecondary opportunities are beyond their control.25
As highlighted in an All4Ed series on states’ CCR indicators, Georgia stands out as having the most meaningful measure of postsecondary success; it looks specifically at the proportion of students that enroll in non-remedial college coursework. This is important because students who enroll in remedial courses are less likely to graduate and must pay for courses that don’t count toward degree requirements. 26 As states continue to develop and refine their CCR indicators — many states have made updates or clarifications to these indicators in recent years — additional research should be conducted to better understand how these indicators are connected to student success and how they are impacting school practices.
One widespread criticism of NCLB was that the focus on proficiency rates in ELA and math led schools to narrow their curriculum and limit instructional time in other subjects.27 28 29 Using ESSA’s flexibility, a subset of states has tried to address this by including measures that rate schools in other subjects. For example, 14 states include a measure of achievement in science. This is perhaps unsurprising, since states are required by ESSA to assess science achievement at least once in grades 3-5, 6-9, and 10-12. Seven of these states also include a measure of achievement in history/social studies.
A smaller group of states is looking beyond core academic classes to incentivize schools to increase student access to enrichment courses, which is linked to higher attendance and student engagement.30 31 32 Four states use indicators connected to physical education and arts classes. Georgia includes indicators for both, as well as for world languages, and rates schools on passage rates rather than enrollment rates, which can help ensure that students have access to high-quality opportunities. Michigan and Illinois use enrichment indicators that measure student-to-staff ratios, in addition to enrollment. While this could incentivize schools to ensure student access, schools may not be able to control their staff ratios if they are set at the district level. As other states contemplate including indicators for enrichment classes, they should carefully consider whether this will incentivize schools to provide high-quality opportunities and whether school leaders have the ability to control their own outcomes.
Bright Spots in the States
 Bright Spots in the States
Chronic absenteeism measures: Most states rate schools on the percentage of students missing less than 10% of school, but a handful use more innovative approaches. Montana sets a higher bar of 5% of missed school days. Indiana also sets a higher bar (4% of days missed) and gives schools credit for every student whose attendance rose by 3 percentage points from the previous year, potentially giving schools more incentive to support students with large numbers of absences.
College & career readiness measures: Georgia has a particularly meaningful measure of postsecondary success, which looks specifically at the proportion of students who enroll in non-remedial college coursework.
School climate measures: Some states use school climate surveys to measure whether schools are creating a supportive, welcoming learning environment for students, but Illinois rates schools on survey participation rates instead of survey results to encourage widespread completion of the survey, which school leaders and educators can use to influence practice.
One of the biggest accomplishments of NCLB was its laser focus on individual student groups. Schools were no longer able to obscure the low performance of Black students or students with disabilities behind averages. School ratings and identification were directly tied to the performance of each student group. In the transition to ESSA, states are still required to assess all students, disaggregate data, and identify schools with very low performance by student groups, but states now have more leeway in how they ensure that all students and student groups are “seen” by their accountability system.
In our review of state plans, EdTrust examined the extent to which student groups are seen by looking at the number of students in any student group required for inclusion in a metric (or n-size), how states incorporate student group performance into school ratings, and the use of “supergroups” that combine multiple student groups together for the purpose of school ratings.
N-Size
Setting the n-size, or minimum number of students required for a student group to be included in school rating calculations or the identification of schools, is a key way for states to ensure that all students are seen by accountability systems. To protect student privacy and ensure that an individual student’s results aren’t identifiable, schools cannot and should not make the n-size too small in accountability systems. A very small n-size can also lead to large swings in performance from year to year, as the performance of any one student would have an outsize impact on a group’s overall performance. Yet, setting a needlessly high n-size could let many schools escape accountability for the performance of all students. A Brookings Institution analysis notes that an n size of 30, the threshold set by 10 states, would exclude nearly 40% of Black elementary-grade students nationwide from subgroup accountability. As a result, schools that are underserving certain groups of students might be overlooked for identification and support because they don’t have enough students from those subgroups to meet n-size thresholds.
A plurality of states (17) uses an n-size of 20, while 13 states use even higher n-sizes, substantially limiting their accountability systems’ ability to hold schools accountable for the performance of all students.
Student Groups in School Ratings
School, district, and state leaders — as well as parents and communities — use school ratings to understand whether schools are meeting students’ needs. While ESSA does not require states to incorporate the performance of individual student groups into a school’s rating? — just the average of all students’ performance — doing so would help ensure that disaggregated group performance on each metric — beyond assessment results — is publicly reported.
Unfortunately, states have largely failed to ensure that school ratings reflect how well schools are serving all groups of students. Just 11 states incorporate the performance of student groups into their overall school performance rating.
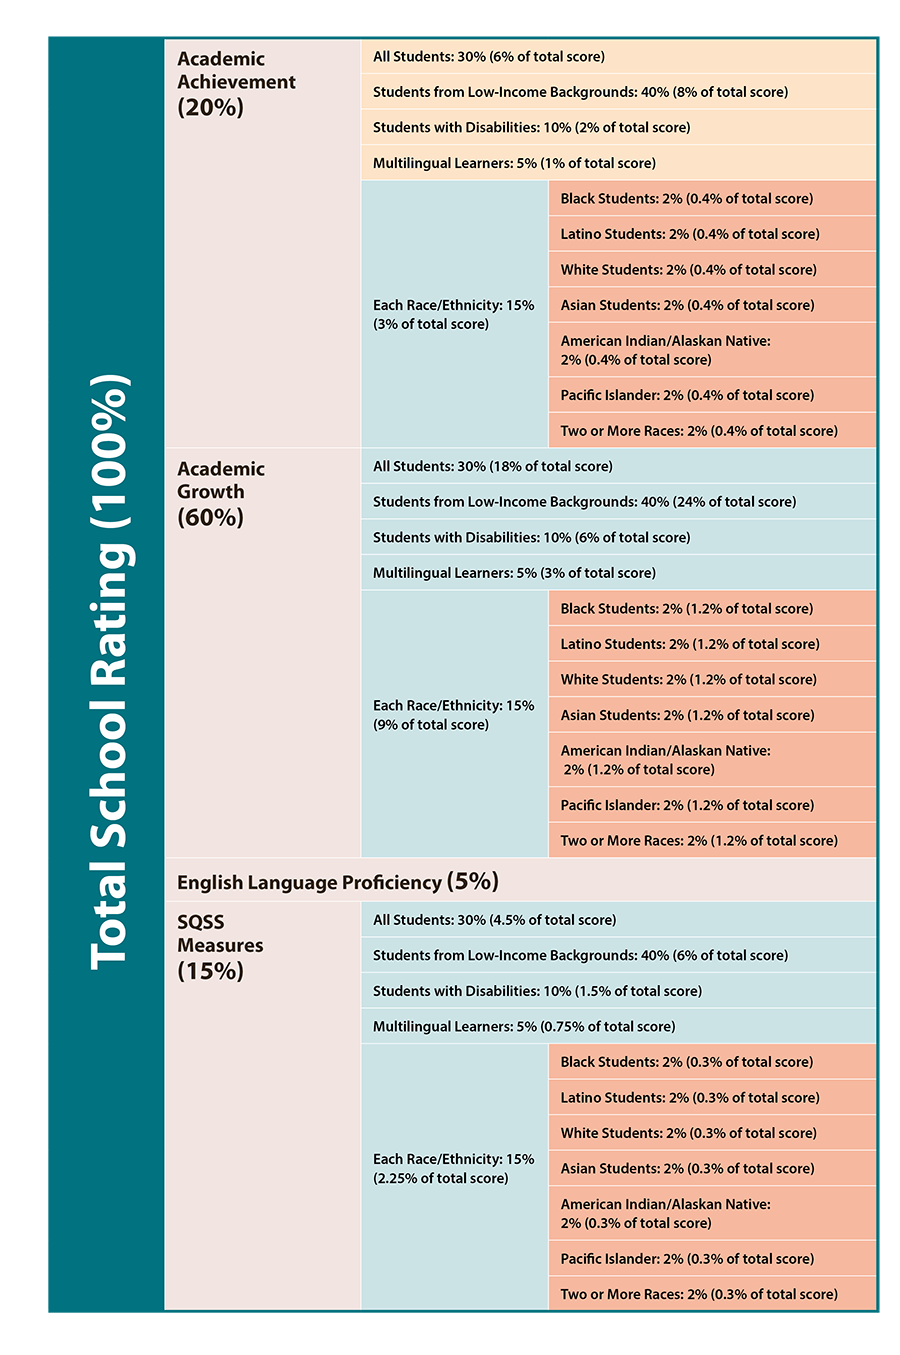
Colorado, New Jersey, and Washington, DC, stand out for having the clearest and most substantial incorporation of student group performance into their accountability system. Both Colorado and New Jersey weigh the performance of student groups, which counts for one-third and one-half of the total indicator score, respectively. Washington, DC, dedicates 70% of each indicator score to student group performance, but assigns different weights by group. The performance of students from low-income backgrounds is weighted more heavily than the all students group (40% vs. 30%). DC also puts substantial weight on the performance of students with disabilities (10%) and multilingual learners (5%), with the remaining 15% distributed equally across each race/ethnicity. These three state systems help ensure that schools are accountable for improving the outcomes of all students by ensuring that the performance of student groups is not only used to identify schools for improvement but also counts substantially toward a school’s overall score.
Infographic
Supergroups
Like the states highlighted above, Connecticut factors student group performance into each indicator score. However, instead of including all student groups, the state’s accountability system features a “high needs” group, which averages the performance of students from low-income backgrounds, multilingual learners, and students with disabilities. While Connecticut should be commended for not using the average of all students to rate schools, as the vast majority of states do, the use of this “supergroup” is problematic because it deliberately excludes student racial and ethnic groups and masks how students of color are performing in a state with some of the widest racial opportunity gaps in the country.33 Texas rates schools using a similar high needs group that also includes highly mobile students; it also consolidates the two lowest performing racial/ethnic groups from the previous year into a single category. This latter supergroup not only fails to include students from all racial and ethnic groups but may create a moving target for improvement if the groups included change from year to year.
By contrast, five other states use student supergroups to increase the visibility of all students in their accountability systems. In these cases, groups of under-represented students are aggregated and included in school ratings or identification only when a group does not meet the state’s minimum n-size. Yet, in all these cases, the state is using a n-size larger than 10, so reducing the n-size could be better way to include more students in their accountability system. Additionally, while the point of using supergroups is to increase the visibility of all groups of students, this kind of consolidation may wrongly suggest that all student groups have similar needs, rather than unique needs that require different supports.
Bright Spots in the States
Bright Spots in the StatesIncluding student groups in school ratings: Colorado, New Jersey, and Washington, DC, clearly incorporate student group performance into their accountability systems. Both Colorado and New Jersey weigh the performance of student groups, which counts for one-third and one-half of the total indicator score, respectively. Washington, DC, dedicates 70% of each indicator score to student group performance, but assigns different weights by group. The performance of students from low-income backgrounds is weighted more heavily than the all students group (40% vs. 30%). DC also puts substantial weight on the performance of students with disabilities (10%) and multilingual learners (5%), with the remaining 15% distributed equally across each race/ethnicity.
Under ESSA, states are required to identify schools for improvement. These schools fall into three categories: comprehensive support and intervention (CSI) — which are the lowest performing schools based on schools’ overall ratings — and targeted support and intervention (TSI) and additional targeted support and intervention (ATSI) — which are schools identified as in need of support based on the performance of individual student groups. TSI and ATSI are important categories because they look beyond the overall strong performance of all students, which can hide opportunity gaps, and allow states to identify schools that have one or more student groups that aren’t getting the supports and services they need to succeed, and provide targeted resources to them.
School Identification Process Under ESSA
What’s more, the failure to identify a low-performing school may limit access to additional resources and targeted interventions for students in those schools, potentially exacerbating educational disparities and hindering efforts to address specific challenges these students may face and impeding their academic progress and overall educational outcomes.
Despite the important equity implications of TSI and ATSI identification, states have substantial flexibility in defining their criteria for TSI identification. States can determine what qualifies as a “consistently underperforming” student group, which triggers TSI identification.
Half of states define consistently underperforming student groups in a way that aligns with EdTrust recommendations. Some states, including Hawaii and South Carolina, use a straightforward approach: They define consistently underperforming groups as those with performance scores in the bottom 10% in the state, double that of ATSI. Promisingly, our analysis revealed that, since 2018, seven states have improved their definitions of consistently underperforming student groups to better distinguish between TSI and ATSI schools.
Other states with TSI definitions that align with our recommendations use student group performance on a subset of indicators. For example, Pennsylvania identifies schools with one or more student groups that have low achievement, low growth, and below-average performance on any SQSS indicator. And Colorado identifies schools in which a student group earns the lowest rating across three indicators. Maine does the same, but looks only at a single indicator, which while it captures more schools than ATSI, could potentially identify more schools than the state can adequately support.
Some states, however, have used federal flexibility to set TSI definitions that are likely to capture fewer schools than ATSI, which is counter to the spirit of the law. For instance, Arkansas identifies schools with groups performing in the bottom 1% of the state, and Arizona identifies schools with groups performing two standard deviations below the state average, which in the 2022-23 school year resulted in the identification of just 19 schools — less than 1% of schools in the state.
When we looked at how states are considering student groups, we were encouraged to find that two-thirds of states appropriately factor in group performance in ways that hold all students to high standards and focus only on student group performance. However, 15 states define consistently underperforming student groups in ways that lower expectations. These states set their thresholds based on group performance that is lower than the average for that group, rather than the average for all students. This effectively means that they are setting different bars for different student groups. Some states do this by explicitly comparing performance within that group. Other states, like Georgia, consider student groups’ progress toward the state’s long-term goals but set different targets for different student groups. Ultimately, ESSA flexibility in the school identification process has led many states to define consistently underperforming student groups in ways that fail to identify — and support — many schools that need to address disproportionate student outcomes.
Bright Spots in the States
Bright Spots in the StatesIdentifying Schools for Improvement: Hawaii and South Carolina, defining consistently underperforming groups as those with performance scores in the bottom 10% in the state, double the threshold of ATSI. Another promising identification practice is focusing on student group performance on individual indicators: Pennsylvania identifies schools with one or more student groups that have low achievement, low growth, and below average performance on any SQSS indicator. And Colorado identifies schools where a student group earns the lowest rating across three indicators.
Equitable accountability systems must be transparent and report information on the performance of schools in ways that are accessible and understandable, so members of the community can clearly see how schools are serving all students. This will go a long way toward establishing trust with community members and empowering them to co-create changes in how schools and districts meet the unique needs of all students.
Additionally, strong reporting systems clearly highlight areas of strength and areas where improvement is needed, so state and national leaders can provide resources for school improvement, instead of solely placing the responsibility on districts, schools, and educators. Strong reporting systems should be easily accessible to the public; provide clear, understandable, and comparable data; and use asset-framing when presenting data.
Accessibility and Clarity of State Report Cards
When we examined states’ online school report cards, EdTrust hoped to see several key features:
Our investigation found that states have a lot of room for improvement when it comes to meeting these standards of transparency and accessibility. While all but two states (Hawaii and New Hampshire) had easy-to-find school reporting websites, just 11 states met all our criteria.
Half of states provide summative ratings of school performance on their online state report card to give stakeholders a clear overview of a school’s performance, but state summative ratings take a few different forms. Just eight states assign schools an A-F letter grade, a practice that has been criticized for unfairly stigmatizing schools. 35 Fifteen states give schools a numerical score on a 1-100 scale, the most common practice. Four states use a 5-star rating system, while five states use descriptive performance bands (e.g., Exceeds Expectations, Meets Expectations, Meets Few Expectations, etc.). Six states combine two of these approaches. Some states, like Kentucky, also indicate whether a school’s summative performance rating represents an improvement, decline, or steady performance from that of previous years.
While we looked for the presence of any summative rating, states may want to use a hybrid approach that provides numerical and descriptive ratings of school performance, so stakeholders can have a clearer understanding. It’s paramount, though, to ensure that school leaders, educators, families, and communities understand and are bought into the rating system. This means state leaders should consult with people from around the state — rather than choose a summative rating approach on their own.
Encouragingly, 30 states allow comparisons across schools on their online report cards; however only 10 of these — among them, Maryland and Nebraska — let stakeholders compare schools with similar characteristics or include disaggregated data in comparisons — as Connecticut and North Carolina do. Both types of comparisons are important because they let school, district, and state leaders consider why schools with similar characteristics might have different performance ratings overall or among certain student groups. Considering such questions in the context of the services and opportunities schools are providing to students can help form the basis for improvement planning — while comparisons of dissimilar schools may be less valuable, since performance differences could be better explained by differing school populations or levels of available resources.
Asset-Framing
Asset-based framing highlights structural barriers and patterns in the education system that contribute to low achievement among students. But asset-based framing is not required by ESSA and the push to use it is recent. It’s, therefore, unsurprising that just four states — Idaho, Kansas, North Dakota, and Oklahoma — include asset-based language in their online school report cards. North Dakota’s data, for instance, is preceded by a two-paragraph introduction that includes a statement that says, “North Dakota public education is rooted firmly in the belief that all schools should be engaged in a cycle of continuous improvement. … While no one report can tell the full story of North Dakota schools, the dashboard features information on important measures that inform stakeholders how to better support students….” Such contextual information can help build trust and understanding about the use and importance of school accountability data.
Bright Spots in the States
Bright Spots in the StatesUsing Asset-based language: Idaho, Kansas, North Dakota, and Oklahoma use asset-based language in their online school report cards. North Dakota’s introduction says, “North Dakota public education is rooted firmly in the belief that all schools should be engaged in a cycle of continuous improvement. … While no one report can tell the full story of North Dakota schools, the dashboard features information on important measures that inform stakeholders how to better support students … .” Such contextual information helps build trust and understanding about the use and importance of school accountability data.
Enabling school comparisons in online school report cards: Maryland and Nebraska let stakeholders compare schools with similar characteristics, while Connecticut and North Carolina include disaggregated data in comparisons. Both comparisons are important because they let school, district, and state leaders consider why schools with similar characteristics might have different performance ratings overall or among certain student groups.
As we’ve noted, how states choose to rate and identify schools in their ESSA accountability systems has important equity implications. Yet if the goal is for accountability systems to enable low-performing schools to improve, ratings and identifications are necessary but insufficient to achieve this goal. While states must identify low-performing schools and assess their needs in order to set clear expectations and provide the guidance, technical assistance, and resources they need to improve — much as a doctor must diagnose a sick patient before treating them —identification is but the first step in treating CSI, TSI, and ATSI schools, which are the lowest performers in a given state. However, every school — especially those that technically fall above identification thresholds but are not adequately serving all students — should be supported to make improvements.
Within ESSA, there are various provisions that, when implemented well, can support effective school improvement. As a part of our analysis, we examined how states set the criteria by which schools may exit status as needing improvement and the types of interventions required when schools identified for improvement and support don’t make progress. We also looked at publicly available information about how states are using their Title I school improvement funds and how they are leveraging the required resource allocation review process.
Exit Criteria
Once schools are identified as CSI, TSI, or ATSI, leaders must work with their staff and communities, along with district and state support staff, to meaningfully improve their performance. Under ESSA, states must determine how much improvement schools must make to no longer be identified as needing improvement.
Unfortunately, not one state meets all our criteria, and just four states set exit criteria that require schools to have performance rates that exceed the cutoff point for classification as chronically low performing. Florida and Louisiana require schools to have an overall C rating to exit identification. CSI schools in Nebraska must outscore the bottom 10% of schools across multiple indicators (double the threshold for identification) and show progress across all indicators. Similarly, Tennessee requires schools to outscore the bottom 10% of schools over two years or the bottom 15% in a single year — though schools are exempt from this requirement if they demonstrate very high academic growth over two years.
While most states don’t set a high-performance bar, many have additional requirements. Thirty states require schools to show substantial growth across some or all indicators in their school rating system to exit identification status. Of these, 11 also require schools to participate in school improvement activities and develop school improvement plans.
Pennsylvania has particularly strong connections to the school improvement process in their exit criteria. In addition to requiring growth in achievement and SQSS measures, Pennsylvania’s exit criteria ask schools to create an improvement plan that explains how they will sustain growth in the absence of supports for identified schools and demonstrate sustained participation in the SEAs technical assistance opportunities for identified schools.
More Rigorous Interventions
Strong actions such as state takeovers have mixed evidence of success and when done need to be undertaken in collaboration with communities. 36 However, having these state actions as options can help motivate school and district leaders to make strategic, systematic changes to policy and practice to raise performance. It can also help state leaders clearly outline how they will support or intervene when changes aren’t made. Additionally, it’s important to require next steps to hold districts and states accountable when they let schools remain in a state of stagnant performance.
States are also supposed to outline a progression of escalating interventions for schools that don’t meet exit criteria over a period set by the state. Unfortunately, the federal government only required states to provide minimal information about their plans for schools that fail to make adequate progress. As a result, most state ESSA plans lack specifics and include generic language that leaves the public with little to no understanding about the consequences or actions that will be taken when schools consistently underperform.
In their plans, states focused on two main categories of more rigorous interventions: 1) increased monitoring paired with additional supports and technical assistance; and 2) changes to a school’s governance or structure.
Nearly three-quarters of states indicated that schools that don’t meet exit criteria will receive additional supports and be subject to increased monitoring. While SEA supports and monitoring are important, such supports should ideally be implemented soon after schools are identified, rather than reserved as more rigorous interventions. Missouri, for instance, states that schools needing more rigorous interventions will be required to meet with school improvement specialists monthly, participate in principal coaching, and create 30-, 60-, and 90-day action plans that will be monitored by state staff.
In contrast, just 17 states indicate that schools that fail to meet exit criteria could be subject to more substantial changes to policy or school oversight, and of these, 11 list potential actions the state could take without committing to any specific intervention — or even intervention at all. Colorado, for example, lists potential actions, including management of the school by an external partner, conversion to a charter school, or school closure, without committing to using any of these strategies at identified schools that don’t make enough progress.
In fact, just six states detailed clearer, more specific consequences in their ESSA plans. Connecticut and Tennessee stand out for outlining comprehensive strategies for escalating supports and interventions for schools that don’t progress. Tennessee has specific tiers of support and interventions based on school performance and improvement, while Connecticut details progressively higher requirements, monitoring, and support for each year a school doesn’t meet the exit criteria, with the final tier including options for changes in school governance or closure. Yet, while these states have clearly defined state supports and interventions, they also have timelines that extend over 10 years, which allows for prolonged periods of low performance.
In contrast, Florida and Rhode Island have specific and immediate consequences for schools that fail to exit identification. In Florida, schools must engage in a two-year turnaround process, which can include school control moving to a charter or other external operator, while Rhode Island requires schools to undergo a total school-redesign process using one of five models, in lieu of the more piecemeal improvement efforts schools may have engaged in since being identified.
These more immediate consequences might create a greater sense of urgency to make changes to school practices but should be paired with the types of supports outlined by Connecticut and Tennessee.
School Improvement Funds
Being identified for improvement also unlocks access to federal school improvement funds. States are required to allocate 7% of their total Title I funding to identified schools. States have lots of flexibility about how these funds are allocated and can attach requirements for obtaining or using these resources. States can allocate these funds via a formula, a competitive process, or a combination of both.
Our investigation of SEA websites found that 37 states published information on how they are using their school improvement funds, while 27 published information on which schools are ultimately receiving these funds. Of the 37 with published information, approximately half use competitive grants (14 states) and the other half use formula grants (16 states). Just two states —Connecticut and Delaware — use our recommended combined approach. Additionally, two of the states using formula grants — California and Minnesota — have application processes that allow them to ensure strong use of funds without a competitive process, another potentially effective approach to allocating school improvement grants.
Indiana has an interesting approach to support schools that have limited capacity to develop school improvement grant applications: Schools that fail to meet the state’s competitive grant requirements receive guidance and support on strengthening their application and are eligible to reapply the following year. Texas is committed to building the capacity of school leaders in identified schools: Grant recipients are required to participate in leadership development and coaching that aligns with their planned improvement areas and utilization of improvement funds.
Michigan, meanwhile, has opted for a unique, and potentially misguided, approach to using its improvement funds. In lieu of allocating school improvement funds to identified schools, the state has opted to use these funds to staff SEA offices that focus on school improvement: such as the Office of P-20 Data and Information Management, Office of Safe and Supportive Schools, and Office of Education Improvement and Innovation. While it is important to build the capacity of SEA offices that support schools, these funds were specifically allocated to support identified schools via direct funding. Further investigation is needed to determine whether this unusual approach is moving the needle on performance in the state’s lowest-performing schools.
Resource Allocation Reviews
In addition to Title I set-aside funds for school improvement, ESSA contains another key provision to support school improvement efforts in identified schools: resource allocation reviews (RAR). Under this provision, states must “periodically” review how districts with a “significant” number of schools identified as CSI, TSI, or ATSI are allocating resources across schools. This process was intended to help districts consider how to redistribute funding and other resources in more equitable ways and ensure that schools and students with the most needs have access to adequate resources. However, the lack of clarity in the words “periodically” and “significant” has allowed states to effectively weaken this requirement. The Department of Education issued a Dear Colleague letter in July 2023 that contained clear, strong guidance on how states should conduct their resource allocation reviews, but this guidance is not mandatory.37
Additionally, while ESSA doesn’t specify the types of resources that should be included in the reviews, the department’s guidance wisely suggests that states look beyond funding amounts and consider equitable access to other types of resources, such as experienced educators, rigorous coursework, and high-quality early learning opportunities. These considerations align with the Alliance for Resource Equity framework 38 — designed by EdTrust and Education Resource Strategies — which some states, including Michigan, highlight in their state guidance documents on this process. 39
Unfortunately, likely due to the lack of strong federal requirements, publicly available information on if and how states are leveraging resource allocation reviews is extremely limited. Just 14 states provide a clear threshold for identifying districts that are eligible for a review, and 15 states indicate that reviews will consider more than just funding, either within their ESSA plan or on their SEA website. Only four states — Michigan, Nebraska, Ohio, and Rhode Island — do both. It’s, therefore, imperative that advocates and the department push states to do more to ensure strong implementation of resource allocation reviews and transparency in the process.
When it comes to identifying districts for review, only Florida includes both a percentage and numerical threshold: 10% of schools or two identified schools. Five other states have a numerical threshold, but four of these states say that reviews will be triggered in districts with any identified schools. This approach would likely result in the identification of more districts than the SEA could effectively manage.
Seven states determine if a district contains enough identified schools to trigger an RAR using percentage thresholds that range from 10% to 50% of schools identified. States that have a threshold of 10% could identify more districts than the SEA could manage. Conversely, those using a threshold of 50% are likely missing many districts that may need help reallocating resource to support a large number of identified schools. Just two states, Nebraska and Ohio — which are, notably, two of the four states with the most comprehensive information on the process overall — strike a good balance with thresholds of 20% and 30%, respectively.
Bright Spots in the States
Bright Spots in the StatesOutlining consequences & next steps for schools that fail to improve: In Florida, schools that fail to exit identification must engage in a two-year turnaround process, which can include school control moving to a charter or other external operator. In Rhode Island, those schools must undergo a total school-redesign, in lieu of more piecemeal improvement efforts schools may have been engaging in since being identified.
Connecticut and Tennessee outline comprehensive strategies for escalating supports and interventions for schools that don’t progress. Tennessee has specific tiers of support and interventions based on school performance and improvement, while Connecticut details progressively higher requirements, monitoring, and support for each year a school fails to meet the exit criteria, with the final tier including options for changes in school governance or closure.
Pennsylvania asks schools to create an improvement plan explaining how they will sustain growth in the absence of supports for identified schools and demonstrate sustained participation in the SEA’s technical assistance opportunities for identified schools.
Helping schools apply for improvement grants: In Indiana, schools that fail to meet the state’s competitive grant requirements receive guidance and support on strengthening their school improvement grant application and are eligible to reapply the following year. In Texas, school leaders in identified schools that receive improvement grants are required to participate in leadership development and coaching that aligns with their planned improvement areas and utilization of improvement funds.
Data collection was completed between September and December 2023, and each state’s data was reviewed by two EdTrust staff members. Data included states’ most up-to-date ESSA plans, including pending redlined versions for states amid active revisions to their plans, and a review of state education department websites. Internal validation was done to ensure that accurate data was collected for each state. Once data was collected for a state, both researchers compared their data and discussed any discrepancies. After data collection and internal validation was completed, we sent a form with the data we had collected to each state department of education for verification and gave them an opportunity to make edits and provide additional information and resources. Between January and March 2024, 29 states responded with comments. States that did not respond were sent follow-up emails. We had specific questions for seven states, so those states were contacted by phone. We also met with officials from two states throughout the process to discuss comments and recent changes that are reflected in this report. The comments of the 29 states from which we received feedback were integrated into our ESSA plan data and are reflected in our analysis. However, it should be noted that many states are still updating their plans, and changes that were made after March 2024 are not reflected in the data. Additionally, our review of state supports for school improvement was limited to a search of publicly available information on SEA websites. Therefore, states may be providing substantial additional supports that are not included in our analysis.
1 Barnum, M. (2017). No Child Left Behind is dead. But have states learned from it? Chalkbeat. Available at:
2 Kamenetz, A. (2014). It’s 2014. All Children Are Supposed To Be Proficient. What Happened? National Public Radio. Available at: https://www.npr.org/sections/ed/2014/10/11/354931351/it-s-2014-all-children-are-supposed-to-be-proficient-under-federal-law
3 While ESSA uses the term “English Learners,” EdTrust prefers to refer to this student group as “multilingual learners” because this language acknowledges that students’ native language skills are an asset in their learning and development.
4 Ushomirsky, Natasha., Smith, Andy., Bommelje, Samantha. (2017). Trends in State ESSA Plans. The Education Trust. Available at: https://edtrust.org/resource/trends-in-state-essa-plans/
5 U.S. Government Accountability Office. (2024). K-12 Education: Education Could Enhance Oversight of School Improvement Activities. Available at: https://www.gao.gov/products/gao-24-105648
6 Riley, D.L., Meredith, J., Butler, A.N. (2019). State Responsibilities and Opportunities for School Improvement Under the Every Student Succeeds Act. Policy Studies Associates & The Council of Chief State School Officers; United States Government Accountability Office (2024).
7 U.S. Government Accountability Office. (2024).
8 Resource Allocation Reviews: A Critical Step to School Improvement. The Education Trust. Available at: https://edtrust.org/wp-content/uploads/2014/09/ESSA_FactSheet__Resource-Allocation-Reviews_Hyperlinks-UPDATED.pdf
9 5 Things to Advance Equity in State Accountability Systems, School Improvement, and Reporting. (2019). The Education Trust. Available at: https://edtrust.org/resource/5-things-to-advance-equity-in-state-accountability-systems-school-improvement-and-reporting/.
10 Saslow, R., Liow, Y., & Barone, C. (2023, April 26). 2022 statewide data update: Too many states falling short on full data transparency. Education Reform Now. https://edreformnow.org/2022/11/29/2022-statewide-assessments-update/
11 Polikoff, M. (2017). Proficiency vs. growth: Toward a better measure. FutureEd. Available at:
https://www.future-ed.org/work/proficiency-vs-growth-toward-a-better-measure/
12 Le Floch, K., Drew Atchison, D., Ozek, U., Hyland, K., Blair, D., Hurlburt, S. (2023). Multiple Measure Accountability Under ESSA: Early Findings From Three States. American Institutes for Research. Available at: https://www.air.org/sites/default/files/2023-04/23-20801-CSI-NCER-ESSA-measures-brief-FMT-ed_rev.pdf
13 Growth data: It matters, and it’s complicated. (2019). Data Quality Campaign. Available at: https://dataqualitycampaign.org/wp-content/uploads/2019/04/DQC-Growth-Data-Resources.pdf.
14 Testina, L., Aldrich, M.W. (2023). Tennessee rushes to revamp its A-F letter grades for schools. Educators cry foul. Chalkbeat Tennessee. Available at: https://www.chalkbeat.org/tennessee/2023/10/26/23929492/school-ratings-a-f-letter-grades-changes/
15 Thapa, A., Cohen, J., Guffey, S., & Higgins-D’Alessandro, A. (2013). A Review of School Climate Research. Review of Educational Research, 83(3), 357-385. https://doi.org/10.3102/0034654313483907.
16 Espelage, D. L., Polanin, J. R., & Low, S. K. (2014). Teacher and staff perceptions of school environment as predictors of student aggression, victimization, and willingness to intervene in bullying situations. School Psychology Quarterly, 29(3), 287–305. https://doi.org/10.1037/spq0000072.
17 Ma, L., Phelps, E., Lerner, J. V., & Lerner, R. M. (2009). The development of academic competence among adolescents who bully and who are bullied. Journal of Applied Developmental Psychology, 30(5), 628–644. https://doi.org/10.1016/j.appdev.2009.07.006.
18 Kraft, M. A., Marinell, W. H., & Shen-Wei Yee, D. (2016). School Organizational Contexts, Teacher Turnover, and Student Achievement: Evidence From Panel Data. American Educational Research Journal, 53(5), 1411-1449. https://doi.org/10.3102/0002831216667478.
19 Batel, S. (2017). Measuring Success: An Overview of New School Classification Indicators Under ESSA. Center for American Progress. Available at: https://www.americanprogress.org/article/measuring-success-overview-new-school-classification-indicators-essa/.
20 Chang, H.N., Osher, D., Schanfield, M., Sundius, J., Bauer, L. (2019). Using Chronic Absence Data to Improve Conditions for Learning. Attendance Works and American Institutes for Research. Available at: https://www.attendanceworks.org/using-chronic-absence-data-to-improve-conditions-for-learning/.
21 Chang, H.N., Romero, M. (2008). Present, Engaged, and Accounted For: The Critical Importance of Addressing Chronic Absence in the Early Grades. National Center for Children in Poverty. Mailman School of Public Health at Columbia University. Available at: https://www.nccp.org/wp-content/uploads/2008/09/text_837.pdf
22 Allensworth, E. M., & Easton, J. Q. (2007). What matters for staying on-track and graduating in Chicago Public Schools: A close look at course grades, failures, and attendance in the freshman year [Research report]. Chicago, IL: University of Chicago, Consortium on Chicago School Research.
23 Neild, R. C., & Balfanz, R. (2006b). Unfulfilled promise: The dimensions and characteristics of Philadelphia’s dropout crisis, 2000–2005. Philadelphia, PA: Philadelphia Youth Network.
24 Duckworth, A., & Yeager, D. (2015). Measurement Matters. Educational Researcher, 44(4), 237-251. Available at: https://www.deepdyve.com/lp/sage/measurement-matters-0W2eReFFKw?articleList=%2Fsearch%3Fquery%3DMeasurement%2BMatters%253A%2BAssessing%2BPersonal%2BQualities%2BOther%2BThan%2BCognitive%2BAbility%2Bfor%2BEducational%2BPurposes.
25 Schweig, J., Pandey, R., Grant, D., Kaufman, J.H., Steiner, E.D., Seaman, D. (2023). American Mathematics Educator Survey: 2023 Technical Documentation and Survey Results. Santa Monica, CA: RAND Corporation, 2023. https://www.rand.org/pubs/research_reports/RRA2836-1.html.
26 Jimenez, L.; Sargrad, S., Morales, J. (2016). Remedial Education: The Cost of Catching Up. Center for American Progress. Available at: https://www.americanprogress.org/article/remedial-education/
27 Hamilton, L. S., et al. (2007). Standards-Based Accountability under No Child Left Behind: Experiences of Teachers and Administrators in Three States. Santa Monica, Calif.: RAND Corporation.
28 Hannaway, J., Hamilton, L. (2008). Performance-Based Accountability Policies: Implications for School and Classroom Practices. Washington: Urban Institute and RAND Corporation.
29 Pedulla, J. J. et al. (2003). Perceived Effects of State-Mandated Testing Programs on Teaching and Learning: Findings from a National Survey of Teachers. National Board on Educational Testing and Public Policy.
30 Bowen, D. H., & Kisida, B. (2021). The arts advantage: Impacts of arts education on Boston students. EdVestors. Available at: https://www.edvestors.org/wp-content/uploads/2021/04/ The-Arts-Advantage-Impacts-of-Arts-Education-on-BostonStudents.pdf.
31 Bowen, D.H., Kisida, B. (2019). Investigating Causal Effects of Arts Education Experiences: Experimental Evidence from Houston’s Arts Access Initiative. Houston Education Research Consortium and Rice University’s Kinder Institute for Urban Research. Available at: https://files.eric.ed.gov/fulltext/ED598203.pdf.
32 Deasy, R.J. (2002). Critical Links: Learning in the Arts and Student Academic and Social Development. Arts Education Partnership. Available at: https://www.govinfo.gov/content/pkg/ERIC-ED466413/pdf/ERIC-ED466413.pdf.
33 Fitch, M. (2023). Connecticut third worst for education equality, according to report. Connecticut Inside Investigator.
34 U.S. Department of Education. (2021). SY19-20 School Improvement Funds 1003(a). ED Data Express. Data File. Available at: https://eddataexpress.ed.gov/download/data-library?field_year_target_id=2696&field_population_value=&field_data_topic_target_id=52&field_reporting_level_target_id=All&field_program_target_id=All&field_file_spec_target_id=All&field_data_group_id_target_id=All&combine=1003.
35 Nordstrom, K., Tillitski, L. (2021). School Performance Grades: A Legislative Tool for Stigmatizing Non-White Schools. Education & Law Project at the North Carolina Justice Center. Available at: https://www.ncjustice.org/publications/school-performance-grades-a-legislative-tool-for-stigmatizing-non-white-schools/.
36 Lieberman, M. (2024). State Takeovers of School Districts Still Happen. New Research Questions Their Value. EdWeek.
37 United States Department of Education. (2023) Dear Colleague Letter: Title I Resource Equity. Available at: https://oese.ed.gov/files/2023/07/DCL-Title-I-Resource-Equity-for-posting.pdf
38 The Education Combination. (2019). The Alliance for Resource Equity. Available at: https://educationresourceequity.org/wp-content/uploads/documents/education-combination.pdf
39 Michigan Department of Education, (2022). Michigan Department of Education Resource Allocation Review Process Guide: A Guide for districts and schools considering resource equity for improving student outcomes, Fall 2022, Lansing, Michigan.

 December 18, 2017 by Natasha Ushomirsky, Andy Smith, Samantha Bommelje
 Strong school accountability systems can send a clear message that the achievement of all groups of students matters and…
s state education leaders redesign their school accountability systems under the Every Student Succeeds Act (ESSA), there’s been a…