Recent changes in federal policy have put even more hurdles in the way of students from low-income backgrounds achieving an equitable education. Their families face the loss of important nutrition aid and health care from the most recent budget bill, and their schools will have to do more with less as they face the loss of $7 billion in funding that covers everything from after-school programs to staffing in high-needs schools.
As advocates and researchers take stock of the impacts of these changes, it’s more important than ever to understand the nuances of what most affects students from low-income backgrounds. While economic status is certainly one important measure, there are also many other markers that influence students’ education: for example, the parents’ education level and the resources available at the school. Researchers often roll these indicators together and refer to them as part of “socioeconomic status,” or SES for short.
Alongside the newest year of data from the National Assessment of Educational Progress (NAEP), NCES rolled out a new index that combines existing measures of individual student economic need plus relevant school-level and in-home factors to try and assess students’ socioeconomic status. This allows researchers to consider things that might not be as immediately obvious when considering just economic status, such as how the other factors may buoy or hinder achievement.
Let’s learn a little more about the index itself. After a recommendation from the National Assessment Governing Board to build out some measurements to track SES (for the reasons above), an expert panel convened by NCES produced a definition of socioeconomic status. The index is comprised of three to four items (depending on grade and data availability):
- Students’ economically disadvantaged status
- Level of economically disadvantaged students at students’ school
- Number of books in the house
- Parents’ highest education (asked of eighth graders only)
For each measure, the index applies up to three points, and depending on the number of points accrued, students are placed into three SES bands: low, middle, and high. Academic scores between students from economically disadvantaged backgrounds generally follows this index, meaning the index is seen as a fair substitute for researchers to understand the impact of socioeconomic status in our schools.
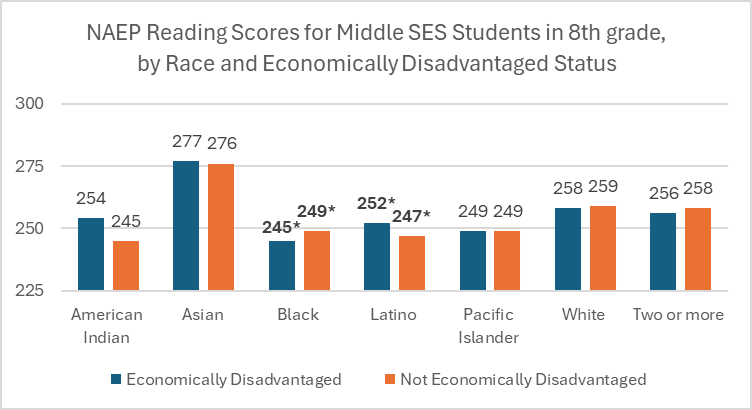
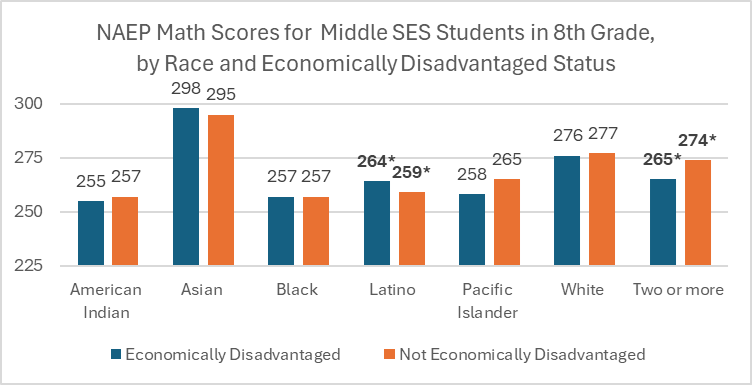
But a deeper dive into the three-item index shows some interesting results: in both reading and math, middle-SES eighth grade students scored generally the same across economic disadvantaged status, with only one or two points difference going either way. In some cases, certain racial groups (most notably, Latino students) who are considered economically disadvantaged performed better than their peers who are not considered economically disadvantaged. What could be the explanation for this?
 July 17, 2025 by Hector Biaggi