Resource

“Student success” is a popular buzz phrase, but it means different things to different people. College and university administrators tend to measure student success on the basis of graduation rates. That’s all well and good, but this overlooks the key reason why many students go to college: to earn a credential that will help them secure a good job and a decent living. Racial and ethnic gaps in college success look a whole lot wider when we consider the latter. Let us show you by more closely examining national graduation and default rates.

Graduation rates highlight large racial gaps in college completion

Hate it or love it, the federal government’s six-year graduation rate for new students who enroll full time has long been the traditional way of defining student success. So, let’s look at graduation rates for students who (1) started at a public or private, nonprofit four-year institution, (2) initially enrolled as full time seeking to earn a bachelor’s degree, and (3) received federal loans (see Figure 1). This data* shows that slightly more than half of Black and Latino (51.5%) students earned a degree after six years, compared with nearly 70% of White students. That’s a graduation rate gap of roughly 18 percentage points.

While alarming, this discrepancy doesn’t fully capture the extent of the problem, because post-college success isn’t included. Think about it. How many students would bother to take out loans and enroll in college and earn a degree (or credential) knowing that their work would not lead to employment that would enable them to repay their loans?

The answer is: not many.

Note: The six-year graduation rates are for students who 1) started at a public or private, nonprofit four-year institution, 2) initially enrolled full time seeking to earn a bachelor’s degree, and 3) and received federal loans in 2003/04.
Source: Authors’ analysis of U.S. Department of Education, National Center for Education Statistics, 2003-04 Beginning Postsecondary Students Longitudinal Study, Second Follow-Up (BPS:04/09).

Default rates suggest there is more to the story

Twelve-year federal loan default rates are useful because they tell us the extent to which graduates are financially capable of making minimum payments on their federal student loans. Given the dire consequences of defaulting on federal loans, a failure to make payments is a good indicator of financial distress. As you can see in Figure 2, the default rates for the same students who completed a bachelor’s at a four-year public or private, nonprofit institution vary considerably by race and ethnicity.

The default rates are almost six times higher among Black graduates and 2.5 times higher among Latino graduates than they are among White graduates. The gap in default rates between Black and White students was nearly 23 percentage points. About 3 in 10 (one-third) Black graduates from four-year public or private, nonprofit institutions defaulted on their student loan, while nearly 14% of Latino graduates did so.

These vast racial and ethnic disparities are almost certainly not the result of wide variations in academic performance, since the GPAs of these graduates were relatively similar across racial groups.1 The differences in default rates were more likely caused by racial differences in (1) employment opportunities tied to students’ majors, (2) institutional reputation (selectivity), and (3) the financial assistance students receive from family to pay back loans.2 Also, let’s not forget that racial discrimination in the labor market is another key factor that must be considered.

Notes: The 12-year default rates are for graduates who 1) started and completed at a public or private, nonprofit four-year institution, 2) initially enrolled full time seeking to earn a bachelor’s degree, and 3) and received federal loans in 2003/04.
Source: Authors’ analysis of U.S. Department of Education, National Center for Education Statistics, 2003-04 Beginning Postsecondary Students Longitudinal Study, Second Follow-Up (BPS:04/09).

A different way to examine college student success

Combining default rates with six-year graduation rates would provide a more comprehensive view of college student success. One could create a similar measure by combining another college completion metric, like the Association of Public Land-Grant Universities’ Student Achievement Measure, with another post-collegiate outcome, like loan repayment rates. However, we focused on six-year graduation rates and 12-year default rates, since this data is currently collected — but more on that later. To calculate this measure, we multiplied a student’s chances of graduating by the likelihood that said student would not default on his or her loans (i.e., 100% minus the default rate). The equation looks like this:

College Success Rate = Graduation Rate X (100% – Default Rate)

The results of our calculations are listed in Table 1. The table features both graduation and default rates, along with the new college success rates on the far right. By our reckoning, which includes both graduation and default rates, the college success rate for White students would decrease from 69.6% to 65.9%. The success rates for Latino and Black students would change, too. And much more dramatically. The rate for Latino students would decline from 51.5% to 44.7%, a difference of 6.8 percentage points. But Black students would see the most significant drop: Their college success rate would decrease from 51.5% to 37.1%, a 14.4 percentage point difference. Moreover, the college success rate gap between White and Black students would be nearly 30 percentage points, and roughly 21 percentage points for Latino students.

If we use only the traditional measure — i.e., college graduation rates — the Black-White and Latino-White completion gaps look identical (18.1%) for our cohorts of students and institutions. However, the inclusion of the default rate data yields a much truer, albeit alarming picture, particularly for Black graduates. This new measure reveals a success gap that is nearly 10 percentage points wider for Black students than the traditional measure (28.8% vs. 18.1%). Although the new gap isn’t much wider for Latinos, this may be a function of Latinos’ tendency to borrow less, and the gap is still 3 percentage points larger than the graduation rate gap (21.3% vs. 18.1%).

Table 1: Graduation, Default, and College Success Rates of Bachelor's Degree Completers with Federal Loans by Race/Ethnicity at 4-Year Public and Private, Nonprofit Institutions
Race6-year Grad Rate6-year Grad Rate Gap12-year Default Rate12-year Default Rate Gap100% minus 12-year Default RateCollege Success Rate*College Success Rate Gap
White69.6%N/A5.2%N/A94.8%65.9%N/A
Black51.5%18.128.0%22.872.0%37.1%28.8
Latino51.5%18.113.3%8.186.7%44.7%21.3
Note: Author’s analysis of the National Center for Education Statistics’ 04/09 Beginning Postsecondary Student Survey. The college success rate is: [Graduation Rate X (100 – Default Rate)] = College Success Rate.
Source: Authors’ analysis of U.S. Department of Education, National Center for Education Statistics, 2003-04 Beginning Postsecondary Students Longitudinal Study, Second Follow-up (BPS:04/09).

Understanding and fixing inequities in student success requires better data

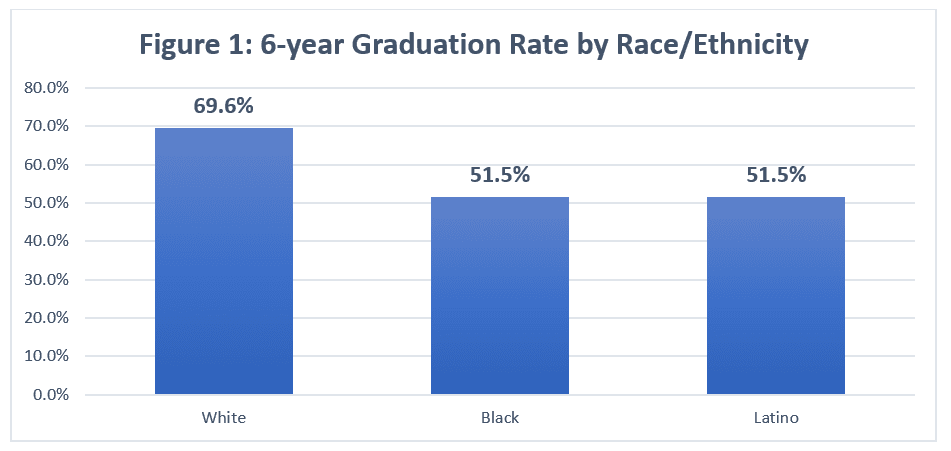
Our analysis shows that the gap in graduation rates doesn’t fully illuminate the racial differences in student success. A successful college experience cannot just be gauged by what happens on graduation day. What happens after a student leaves and enters the workforce must be considered, too.

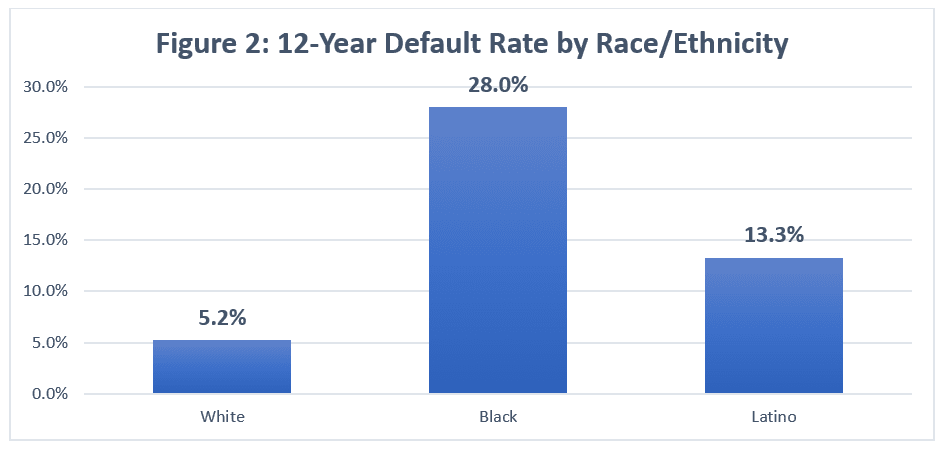
We need better data on this. Each year, the Department of Education (ED) collects and reports some data from its National Student Loan Data System (NSLDS) (i.e., three-year cohort default rates). But, currently, we have no way of consistently knowing how federal loan default rates differ by race and ethnicity at individual colleges and universities. This is a huge problem. Although we used data from the Beginning Postsecondary Student (BPS) Longitudinal Study to capture default rates by race and ethnicity, BPS only tracks a cohort every eight years, making it difficult to get timely data on how and to what extent loan default rates differ by race. The ED must create a secure federal student-level system of de-identified data that connects student characteristics — such as income, parental education, and race — with financial aid, enrollment, and completion records. The good news is, the College Transparency Act, if enacted, would do just that, while helping to ease a reporting burden that is already overwhelming many of our postsecondary institutions.

The bad news is, better data won’t magically lower loan default rates, but in the hands of students and parents, policymakers, and institutional leaders, it could help ensure that the federal government and taxpayers — not to mention, students themselves — get a better return on their $60-billion-a-year-investment in undergraduate loans. At the very least, it would give students and parents a more accurate and inclusive picture of which colleges actually prepare students for success, thereby helping students to avoid those institutions that produce default-prone graduates. Policymakers could use this data to develop stronger consumer protection policies that incentivize institutions whose graduates don’t do well in the labor market to improve. Better data could also help institutional leaders make better decisions about how they allocate student support resources. For the time being, graduation rates will have to do, but acquiring more and better data must be a priority as Congress looks to reauthorize the Higher Education Act.

Quite frankly, we can and should do better. Our students deserve it.

*Editor’s note: The Education Trust follows new guidelines of The Associated Press on using singular verbs and pronouns with the word data.

  1. GPA for White = 3.29, GPA for Black = 3.02, GPA for Latino = 3.12. Source: U.S. Department of Education, National Center for Education Statistics, 2003-04 Beginning Postsecondary Students Longitudinal Study, Second Follow-Up (BPS:04/09).
  2. 22.2% of White students reported having help paying back loans, compared with 13.0% of Black students and 9.7% of Latino students.