5 Things Equity Advocates Should Know About… The 2023 THEC Fact Book
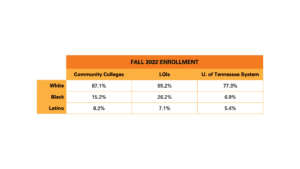
1. In 2022, students of color accounted for larger enrollment proportions in higher education than ever before.
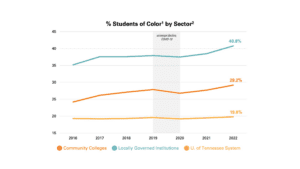
1THEC Factbook reports “non-white” student headcount prior to 2020; the non-white category includes Alaskan Native, American Indian, Asian or Pacific Islander, Black or African American, Hispanic, and Multiracial.
2View page iv of the Fact Book for a sector-by-sector breakdown of Tennessee’s public higher education governance structure. The community college sector includes 13 institutions governed by the Tennessee Board of Regents. The UT system includes four, four-year institutions. Among Locally Governed Institutions (LGIs), all six institutions offer four-year degrees. Due to its inclusion of Tennessee State University and University of Memphis, which historically enroll large Black student populations, the LGI sector enrolls disproportionately high rates of students of color.
Tennessee’s postsecondary system enrolled record-high proportions of students of color in 2022. Latino representation has increased across all sectors since 2020, suggesting that Latino students are a driving force in the steady transformation of the state’s college campuses. In comparison, Black student representation has increased modestly at community colleges and Locally Governed Institutions, but recently declined within the University of Tennessee System.
 Demographic trends in the state’s postsecondary system parallel trends in K-12 education. A diversified K-12 population certainly impacts enrollment demographics among first-time freshmen, but it also impacts the postsecondary system through dual enrollment. Over the last ten years, the number of Black students participating in dual enrollment opportunities more than doubled; Latino enrollment more than quadrupled. Importantly, research demonstrates that advanced coursework meaningfully increases a high school graduate’s likelihood of postsecondary enrollment. Over the next few years, upticks in Black and Latino dual enrollment may be an important lever to reduce college-going gaps.
As advocates continue to call attention to racial gaps in college-going, the “who” of student enrollment should also be contextualized with the “where.” The greatest gains in campus diversification were reported among community colleges and Locally Governed Institutions – largely driven by Tennessee State University. These institutions are also some of the lowest-resourced campuses in the state. Compared to four-year institutions, Tennessee community colleges receive an average of $1,367 less in state appropriations per pupil and collect far less in tuition revenue. Tennessee State University – the state’s only public Historically Black College or University (HBCU) – has been even more severely underfunded than Tennessee legislative reports initially estimated, according to a recent letter from the U.S. Department of Education. Thus, enrollment distributions are inextricably related to resource distributions, which have critical implications for student persistence and success.
2. The Tennessee College of Applied Technology (TCAT) reported a 17% enrollment surge from Fall 2021 – Fall 2022, bolstered by increases in Black and Latino student enrollment.
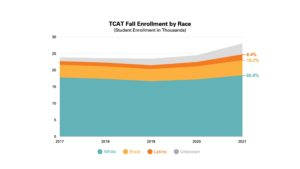
The Tennessee College of Applied Technology system, which currently hosts 27 locations across the state, enrolled a record-high of 35,442 students in 2021-2022. TBR dashboards demonstrate that Black and Latino enrollment proportions have continuously increased since 2017. The system’s rapid expansion coincides with a $1B investment in the TCAT Master Plan, which outlines preparations for state-wide improvements, including six brand new campuses across Tennessee.
As TCAT braces to serve more students than ever, enrollment growth should be carefully monitored alongside student success metrics. In 2022, 17% of TCAT’s 7,081 award recipients were Black; 6% were Latino. These proportions closely mirror the demographics of enrollees, providing encouraging evidence of equity in student support. However, advocates should monitor this metric going forward–how will TCAT student services scale and respond to its largest, most diverse student population to date?
3. After a concerning dip in first-year retention rates3, both community colleges and universities posted slight improvements in 2021.
3Per THEC: Retention rates reflect the percentage of the first-time, full-time students who remain enrolled at any Tennessee public institution in the following fall term.
Coinciding with the pandemic, retention rates dropped to historic lows in 2020. This year’s data show signs of recovery: Among universities, the average retention rate bounced back to 80.5%, recovering half of the percentage points lost between 2019-2020. Among community colleges, the average retention rate was reported at 54.7%, one percentage point shy of the pre-pandemic rate.
First-year retention rates offer key insights into one of the more precarious moments along the journey to graduation. Disaggregating this data by race and income is critical to understanding how various student groups are navigating their way through the education pipeline. While THEC reports 6-year graduation rates by race and by Pell status, it does not report disaggregated data for retention. Insights can be garnered from localized data sources, such as TBR’s student success dashboard or UT-Knoxville’s Fact Book, but advocates should continue pushing for centralized, disaggregated data whenever possible.
4. Completion gaps persist among Black, Latino, and students from low-income backgrounds, especially at four-year institutions.
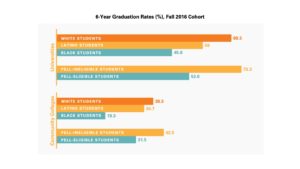
Across all sectors, the gap between White and Black student graduation rates has hovered around twenty percentage points since the first Fact Book was published in 2012. This year, the gap grew even wider at four-year institutions, climbing to 23.5 percentage points. Less than half of Black students at four-year institutions graduate within six years; at community colleges, Black graduation rates plummet to less than one in five. For Latino students, graduation gaps are narrower, but just as persistent. The most recent cohort reported an eleven-point gap between Latino and White graduation rates at universities and a four-point gap at community colleges – exactly mirroring those reported in 2016.
Disaggregated by socioeconomic status, student outcomes continue to be marked by entrenched disparities. Pell-Eligible students graduate from four-year institutions at rates 21 percentage points below their wealthier peers; at community colleges, this gap is 11 percentage points.
Completion gaps are not inevitable, and research from The Education Trust highlights proven strategies that institutions can deploy to promote success for low-income students and students of color. From a state policy perspective, THEC can incentivize institutions to reduce equity gaps through Tennessee’s outcomes-based funding formula. Currently, the formula offers premiums to institutions that serve “focus populations,” including adult, low-income, and academically underprepared students. The Education Trust–Tennessee’s Policy Agenda urges policymakers to keep equity top of mind as the funding formula undergoes review in 2024.
5. At community colleges, net price4 estimates for low-income families have increased by 9% over the last five years.
4Per THEC: “Net price is calculated by adding the advertised price for tuition, fees, books, supplies, and the average living costs at the school, and subtracting the average grant and/or scholarship aid. Net price is calculated as the average for all full-time, first-time students who receive federal financial aid. For public colleges, the average cost for in-state students only.”
For the majority of community college students, the cost of attendance is rising in Tennessee. Whereas approximately half of the students attending four-year institutions in Tennessee come from low-income backgrounds, more than 65% of community college students qualify for the federal Pell grant. Over the last five years, the Fact Book reports that the net price of community college – $5,352 – has increased by 9% for the lowest-income families. Concerningly, net price has increased for low-income community college students (family income between $0-$48,000) more than any other group of students in Tennessee.
Trends in affordability have important implications for student enrollment, persistence, and completion. Tuition and financial aid policies play a critical role in narrowing college-going and graduation gaps that persist throughout our education system. The Education Trust–Tennessee advocates for equitable policies that directly support underserved students. Learn more by exploring our advocacy hub.
Equity Considerations
- Black and Latino representation is increasing on Tennessee campuses, but large completion gaps remain. How might the state’s outcomes-based funding formula be leveraged to address these gaps? How will we protect students from the risks associated with stopping out?
- Who is benefiting most from Tennessee’s financial aid programs? How might eligibility requirements better acknowledge the realities of students from low income backgrounds?