
Breaking Down the Nation’s Math Scores
2023 NAEP math scores are in and it’s clear students of color were impacted by the pandemic.


2023 NAEP math scores are in and it’s clear students of color were impacted by the pandemic.

The National Assessment of Educational Progress (NAEP), or the Nation’s Report Card, released its 2022 math test scores in late 2023, and the results were disturbing. Soon after, data findings released from Program for International Student Assessment (PISA) and the Civil Rights Data Collection (CRDC) added fuel to the fire. It’s become crystal clear that the education system has failed to give our nation’s students the resources they need to succeed.
If evidence-based interventions aren’t implemented, America’s youth could face lower prospects for their future. Strong math literacy prepares students for careers in and outside of science, technology, engineering, and math (STEM), which give young people greater access to the high-paying, high-skilled jobs of the future.
As schools continue to address unfinished learning, or learning loss, it’s important to understand how students are faring in math and how the pandemic has stymied student achievement.
While math scores have stagnated since 2013, there is a noticeable decline between 2019 and 2022 —the height of the pandemic. Recently, scores for the lowest-performing students have been declining, while the highest-performing students have been rising, showing substantial and sustained gaps across student groups, and illuminating also that our nation’s schools have the potential to support strong student achievement — but that attention needs to be paid on students already being underserved.
EdTrust’s work shows the importance of school climate and equitable access to rigorous math that may be standing in the way. We have looked at inequities in the enrollment and persistence of Black and Latino students in advanced STEM courses and have identified how enrollment inequities are based on systemic biases and barriers in access, including the lack of racially and culturally relevant assessments that would better evaluate what students can truly do.
Additionally, our work has confirmed that Black and Latino students often aspire to go to college and are interested in STEM courses, but they are often pushed out of the STEM pipeline due to limited course availability, educator biases, and racialized tracking that begins as early as elementary school.
Increasing access to strong math education requires a commitment from state and district leaders to collect and analyze disaggregated participation and outcomes data and targeted, data-informed efforts to develop policies that increase access to, and success in, high-quality math coursework. With that in mind, EdTrust analyzed 2019 and 2022 NAEP data. This is an overview of those findings.
Black, Latino, and low-income students have been hit the hardest by pandemic-related disruptions
For students who took eighth grade math in 2022, the average Black or Latino student or student from a low-income background performed below basic proficiency.
NAEP identifies three achievement levels for each assessment: Basic, Proficient, and Advanced. Students not achieving basic proficiency are below basic.
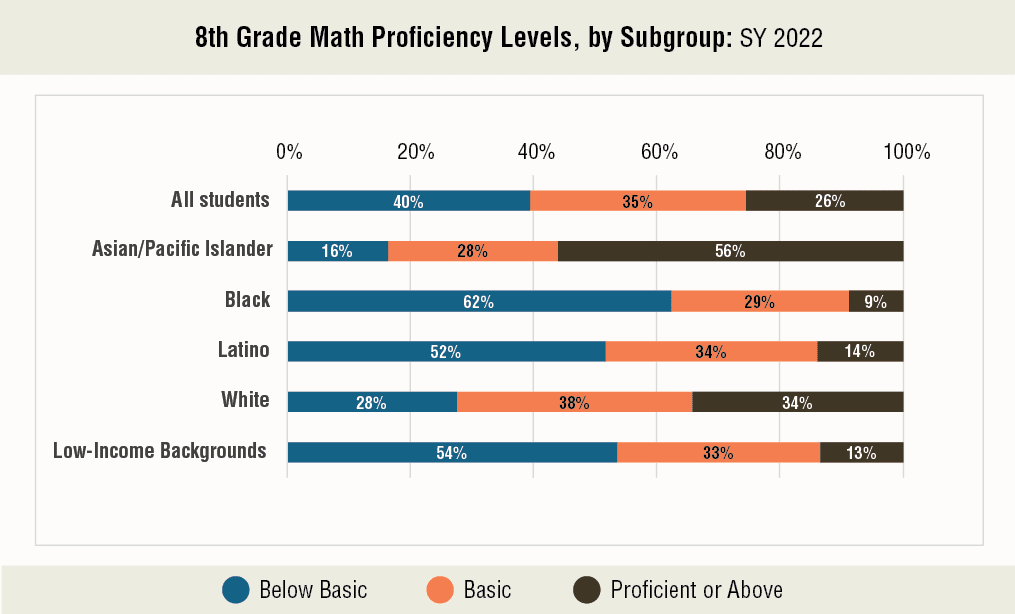
Reading this figure: In 2022, 40% of all students scored Below Basic on 8th grade math.
Source: EdTrust analysis of the National Assessment of Educational Progress (NAEP) (Accessed October 2023)
According to NAEP, Basic mastery “denotes partial mastery of the knowledge and skills that are fundamental for proficient work at a given grade.” Examples of what eighth-grade students performing at the NAEP Basic level can likely do include:
It’s unacceptable that more than half of Black and Latino students and students from low-income backgrounds are not receiving the supports and instruction needed to perform at Basic proficiency.
And the pandemic only exacerbated existing gaps. While all student groups experienced a decline in scores, Latino students and students from low-income backgrounds — who, on average, were scoring above the Basic proficiency level before the pandemic in 2019 — were allowed to drop below Basic proficiency in 2022.
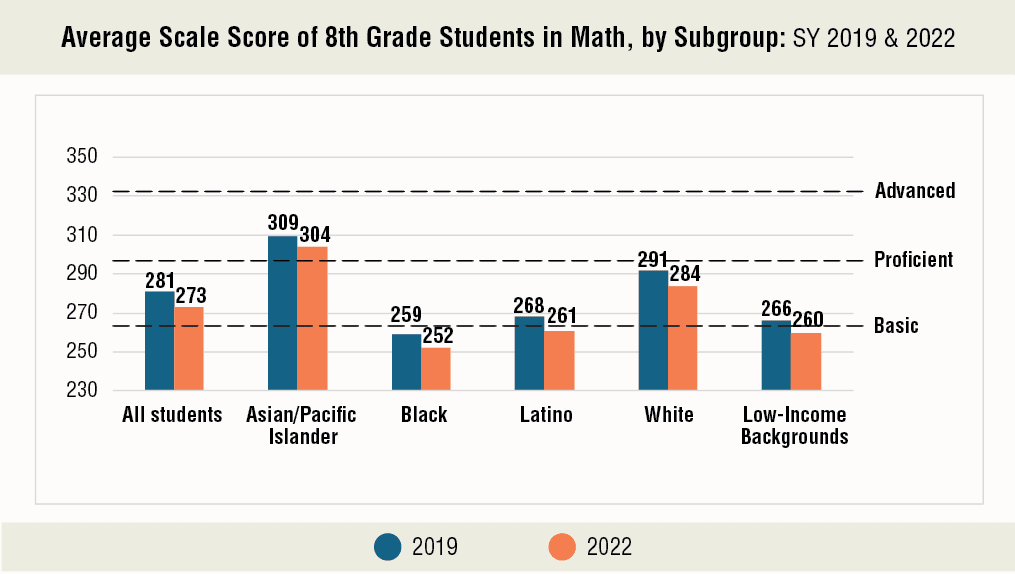
Reading this figure: In 2019, the average scale score for all 8th grade students in math was 281.
Source: EdTrust analysis of the National Assessment of Educational Progress (NAEP) (Accessed October 2023)
Note: NAEP uses a composite scale, ranging from 0-500, that is a weighted combination of subscales based on content areas, such as measurement, geometry, and number properties. NAEP’s three achievement levels for each assessment and the cut points for 8th grade math are presented as lines on the graphs above.
Students enrolled in advanced math classes (about a third of all students) had higher test scores, but there is still a gap between Black and Latino students and students from low-income backgrounds compared to all students.
9 in 10 Black 8th graders did not have the necessary supports to work with decimals, simple fractions, or common percentages
Proficiency went down for all subgroups except for Asian students when comparing scores in 2011 to scores in 2022. Despite some very small gains and losses in the years between, there was a precipitous decline between 2019 and 2022 for all student groups.
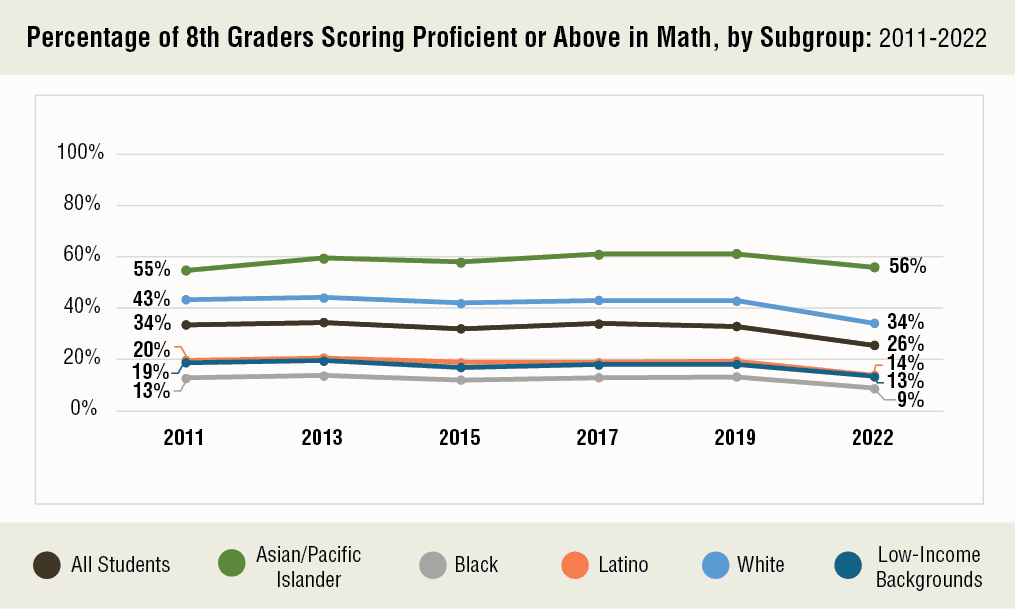
Reading this figure: In 2022, 26% of all 8th grade students scored Proficient or above in math.
Source: EdTrust analysis of the National Assessment of Educational Progress (NAEP) (Accessed October 2023)
Strikingly, just 9% of Black eighth graders received the support and instruction needed to score at Proficient or above in 2022. In other words, 9 in 10 Black eighth graders scored at the Basic or Below Basic levels in 2022.
Examples of what eighth-grade students performing at the NAEP Proficient level can likely do include:
Only 1 in 3 Black, Latino, and low-income students feel very confident in math
Unsurprisingly, as confidence in math rises, so do scores. Yet from 2019 to 2022, the percentage of students who reported high confidence fell across all subgroups. Math confidence is lowest among Black and Latino students and students from low-income backgrounds.
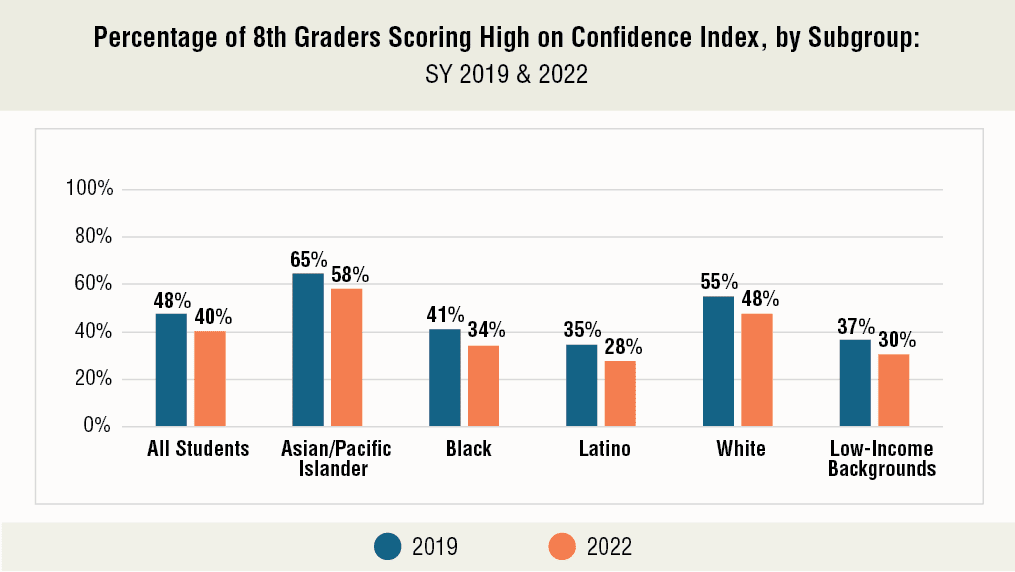
Reading this figure: 30% of 8th grade students from low-income backgrounds exhibit high confidence in math.
Source: EdTrust analysis of the National Assessment of Educational Progress (NAEP) (Accessed October 2023)
Irrespective of year, more students in Algebra I (an advanced class) show higher confidence with math (56%), compared to eighth grade math (31%), despite it being objectively harder content (this goes up to 64% when looking at students enrolled in Algebra II or Geometry). This may be because these students have already seen success in math performance or have been identified as ”math people,” but it can also speak to intentional efforts in classrooms that provide high expectations and positive experiences around math.
The recent NAEP data points out necessary targets for interventions to increase access to and success in rigorous math coursework for Black and Latino students and students from low-income backgrounds. State and district leaders should:
(1) Invest in evidence-based strategies to strengthen fundamental math concepts, such as high-impact tutoring for struggling students and intentional professional learning for teachers
Promising practice: Utah was the only state in the nation whose eighth grade Mathematics NAEP scores had no statistically significant drop from pre- to post-pandemic. Utah’s schools offer small math labs, in place of an elective, that offer just-in-time support that works to bridge knowledge to grade level content and build confidence.
Promising practice: Louisiana’s Math Refresh initiative leveraged federal relief funding to address unfinished learning in math using high-quality instructional materials, targeted intensive tutoring, and summer family engagement to accelerate student learning and ensure proactive interventions when needed.
(2) Implement automatic enrollment policies that more equitably enroll students who are ready and eager to be in advanced classes based on multiple measures
Promising practice: In 2023, Texas passed SB 2124, which requires districts to automatically enroll sixth-grade students who performed in the top 40% on the fifth-grade end-of-year test, or a local measure, in an advanced math course unless the student’s parent opts out. The law was passed after similar local policies eliminated wide racial disparities among high-performing students accessing advanced math in middle school.
(3) Foster positive school climates
Math is for everyone. But unfortunately, many students, especially Black and Latino students, don’t receive that message. High-quality, culturally sustaining, student-centered math curricula that connects students’ lived identities with the content can help students feel they belong in the classroom, acquire deeper understandings of math concepts, and develop a positive math identity. See the Pathway to Equitable Math Instruction toolkit for best practices for educators to center equity in math classrooms.
For more on how states and districts can connect students of color to high-quality math opportunities, see our resource hub for improving access to advanced coursework.

 September 11, 2025 by Ivy Morgan
 Amid a literacy crisis, new national assessment results show that reading scores for high school seniors are at an all-time low
 July 17, 2025 by Hector Biaggi
 New NAEP data has a new index to assess students’ socioeconomic status, but with recent NAEP cuts, this data may never come to light
 March 27, 2025 by Ivy Morgan
 Republican governors from ten states attended Trump’s EO signing to dismantle the Dept. of Ed. But these states’ students perform poorly